
Meet your AI SRE teammate
Built for site reliability engineering teams who need more than dashboards.
Lower observability costs ● Get to the root cause faster ● Deliver reliable production outcomes.


60-70%
Lower observability cost vs. mainstream solutions
<5 min
To sign-up and connect your stack
40%
Faster mean time to resolution
Secure
SOC 2 Type II · GDPR aligned
OpsPilot is an AI-Powered observability and site reliability platform designed to reduce operational complexity, lower observability costs, and help engineering teams resolve incidents faster

Vinay J - Head of Platform Engineering
OpsPilot surfaces exactly what needs attention — the AI suggestions are genuinely useful, not just noise.
Enterprise-ready security and compliance
SOC 2 Type II Certified · GDPR aligned · Built for secure enterprise operations
Working 24/7 across your entire stack
OpsPilot automatically investigates and correlates – then explains exactly what happened and what to do next
I've correlated this with a database connection pool exhaustion event that began 14 minutes before your first alert fired. Root cause: pool limit of 15 is insufficient during peak load (2–4 PM EST).
Recommended actions: Increase connection pool (15 → 30), add connection timeout alerts, review slow queries in payments DB. I've drafted a runbook — want me to send it to Slack?
Ingesting telemetry signals
Analysing 339 metrics · 12 services · 4.2M log lines · 18K traces from the last 30 minutes
Cross-service correlation complete
Found 3 correlated anomalies. Payment service latency spike correlates with DB connection exhaustion (confidence: 94%) — not the downstream API timeout as initially flagged.
Root cause identified · Remediation ready
Database connection pool exhaustion in payment-processor. Runbook generated. Delivering to #ops-alerts in Slack.
Root cause: Database connection pool exhaustion causing cascading failures. 67% of incoming requests failing.
Time to fix: ~8 minutes with recommended actions.
📋 Runbook ready · 🔗 Full analysis in OpsPilot
Memory leak pattern detected — auth-service
Heap usage growing 2.3% per hour for 72 hours. Based on historical patterns, this will cause an OOM crash within 18–24 hours. Recommended: restart schedule + heap dump analysis.
Cost optimisation — over-provisioned metrics retention
You're retaining 28-day metric data but only querying the last 7 days 96% of the time. Reducing retention could save $340/mo.
Recurring incident resolved — DB connection exhaustion
This has occurred 4 times in 30 days. OpsPilot has added this to your incident memory. Future occurrences will be resolved automatically with the approved runbook.
Rene H - SRE Lead
The AI support is genuinely useful — it helps narrow down errors fast and tells you what to fix, not just what broke.
From your existing stack to AI-powered action
No migration. No rip and replace. Three steps and your AI SRE teammate is live.

Connect to your existing stack
Point your OTel pipeline at OpsPilot. If you use Grafana, or any OTel-compatible source, you’re 90% there.

AI analyses your stack
Your AI coworker starts watching immediately, correlating metrics, logs and traces to learn your baseline.

Answers delivered where you work
Root cause, recommended fix and runbook appear in Slack or Teams before your team opens a dashboard.
Keep your existing telemetry stack. Add AI-powered SRE capabilities.
Works with Grafana, Prometheus, and OpenTelemetry — adding AI investigation and autonomous action on top of the tools your team already trusts.
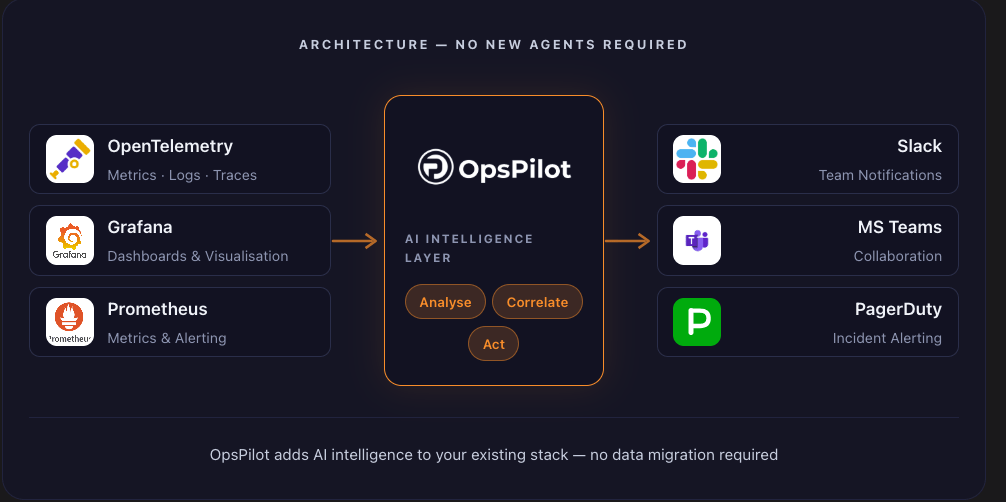
OpsPilot integrates with your existing observability stack in minutes — no migration, no rip-and-replace, no new agents required. Whether you’re running Grafana, Prometheus, or any OpenTelemetry-compatible source, OpsPilot adds the AI intelligence layer your current tools don’t provide.
Already using Datadog or New Relic? OpsPilot works alongside those too — delivering AI SRE capabilities at a fraction of the cost.
Brandon B - Director of IT Operations
The AI capabilities are straightforward to use, and the support team ensures an excellent experience from day one.
Why teams switch to OpsPilot over the alternatives
Higher G2 scores for support, setup speed, and overall satisfaction – at 60-70% lower cost
| OpsPilot AI-powered observability & site reliability |
Overall73.69OpsPilot | Ease of Use8.8OpsPilot | Support9.7OpsPilot | Ease of Setup9.0OpsPilot | Ease of Admin9.1OpsPilot | Meets Requirements9.5OpsPilot | Recommend9.6OpsPilot | Product Direction9.4OpsPilot |
|---|---|---|---|---|---|---|---|---|
New Relic Full-stack observability |
70.60+3.09 |
8.4+0.4 |
8.3+1.4 |
8.2+0.8 |
8.8+0.3 |
9.3+0.2 |
9.2+0.4 |
9.2+0.2 |
Datadog Cloud-native observability |
83.5+9.19 |
8.2+0.6 |
8.3+1.4 |
8.3+0.7 |
8.2+0.9 |
8.8+0.7 |
8.8+0.8 |
9.0+0.4 |
SolarWinds APM Infrastructure monitoring |
58.21+15.48 |
8.2+0.6 |
8.7+1.0 |
8.0+1.0 |
8.6+0.5 |
9.1+0.4 |
9.1+0.5 |
9.1+0.3 |
Grafana Labs Visualization platform |
55.31+18.38 |
8.3+0.5 |
8.2+1.5 |
8.3+0.7 |
8.5+0.6 |
9.1+0.4 |
9.0+0.6 |
9.1+0.3 |
Sentry Error tracking |
55.23+18.46 |
8.5+0.3 |
8.2+1.5 |
8.1+0.9 |
8.7+0.4 |
9.2+0.3 |
9.0+0.6 |
9.2+0.2 |
Splunk Enterprise SIEM & logs |
41.90+31.79 |
8.1+0.7 |
8.2+1.5 |
7.5+1.5 |
8.4+0.7 |
9.0+0.5 |
9.0+0.6 |
9.0+0.4 |
Honeycomb Observability exploration Limited sample — 16 reviews |
32.69+41.00 |
— | 9.3+0.4 |
— | — | — | 8.0+1.6 |
10.0−0.6 |
Elastic APM Search platform extension Limited sample — 14 reviews |
19.79+53.90 |
7.5+1.3 |
8.9+0.8 |
— | — | 9.0+0.5 |
8.0+1.6 |
— |
What users say about OpsPilot
Vinay J - Head of Platform Engineering
OpsPilot surfaces exactly what needs attention — the AI suggestions are genuinely useful, not just noise.
Brandon B - Director of IT Operations
The AI capabilities are straightforward to use, and the support team ensures an excellent experience from day one.
Rene H - SRE Lead
The AI support is genuinely useful — it helps narrow down errors fast and tells you what to fix, not just what broke.
Your path to autonomous operations
- Alert-driven investigation
- Manual root cause analysis
- Dashboard-led decisions
- High incident fatigue
- AI-surfaced recommendations
- Continuous stack analysis
- Health scoring & trends
- Proactive gap detection
- Insights delivered to Slack
- Self-healing runbooks
- Automated remediation
- AI SRE teammate
- Continuous learning
OpsPilot meets you where you are — and grows with you.
Simple Fair Pricing
Ready to add an AI SRE teammate?
Connect your OpenTelemetry pipeline in 5 minutes and your new AI SRE Coworker is part of the team.
Frequently asked questions
-
AI Site Reliability Engineering (AI SRE) uses artificial intelligence to automate the investigation, triage, and remediation of production incidents. Instead of engineers manually checking dashboards and correlating signals, an AI SRE like OpsPilot's Coworker continuously monitors your stack, identifies issues, and delivers prioritized findings and recommended actions — 24/7.
-
Autonomous reliability means your observability stack doesn't just collect data — it acts on it. OpsPilot moves beyond reactive alerting to proactively investigate incidents, detect patterns before they become outages, and continuously improve operational outcomes without requiring manual intervention from your engineering team.
-
OpsPilot integrates natively with OpenTelemetry (OTLP), Grafana, and Prometheus, and works alongside existing tools including Datadog, Dynatrace, and New Relic. No new agents are required. If you're already sending telemetry data, OpsPilot connects in minutes.
-
No. OpsPilot adds an AI intelligence layer on top of your existing observability stack. It ingests your current telemetry via OpenTelemetry's OTLP standard — no data migration, no rip-and-replace, no new agents to deploy.
-
OpsPilot helps engineering teams reduce observability spend in two ways: by identifying gaps and redundancy in your current instrumentation, and by replacing expensive legacy platforms like Datadog or Dynatrace with a modern AI-powered alternative at 60–70% lower cost. The pricing page includes a live cost comparison calculator.
-
Yes. OpsPilot is SOC 2 Type II certified and GDPR aligned. Security and compliance details are available at trust.intergral.com.
OpsPilot, formerly FusionReactor Cloud, is Intergral’s AI-powered observability and AI SRE platform.