
OpenTelemetry — native AI SRE
OpenTelemetry collects your data.
OpsPilot tells you what to do with it.
Most teams using OpenTelemetry are paying Datadog, Dynatrace, or New Relic to store it and visualize it — but still spending hours manually figuring out what matters. OpsPilot is the OpenTelemetry-native AI SRE platform that adds the intelligence layer your current stack is missing. At 60–70% lower cost than mainstream observability platforms.
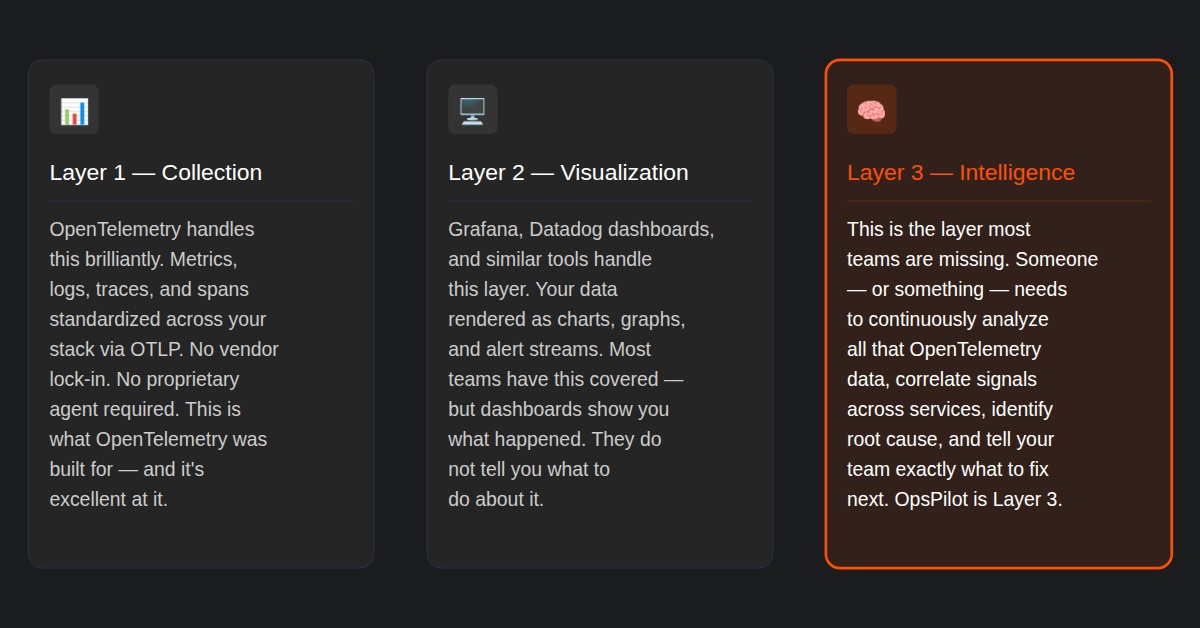
The intelligence gap
OpenTelemetry solves collection. It doesn't solve investigation.
OpenTelemetry has become the standard for telemetry collection across cloud-native stacks. But collecting data is only the first layer. Most teams still spend hours manually analyzing it to figure out what actually matters — and what to fix next. We wrote about this in detail: Your observability stack is missing Layer 3.
OpenTelemetry-native AI SRE
What OpsPilot does with your OpenTelemetry data
OpsPilot ingests all four OpenTelemetry signal types and cross-correlates them continuously to surface the insights that matter — delivered to Slack, Microsoft Teams, or wherever your team works, before anyone opens a dashboard.
Metrics analysis
OpsPilot analyzes counters, gauges, and histograms across your stack to surface performance bottlenecks, cost waste, and degradation trends — including P99 latency regressions, connection pool saturation, and over-provisioned resources your team would never spot manually.
Log intelligence
OpsPilot mines your OpenTelemetry log data for error patterns, severity distributions, and anomalies across services. It identifies new exception types, silent failures with no span error attribute set, and services that appear in traces but emit no structured logs at all.
Trace investigation
End-to-end request journeys mapped and analyzed across services. OpsPilot identifies latency hotspots, N+1 query patterns, and services missing from your instrumentation coverage — the things that cause incidents but never appear on a single dashboard.
Span-level root cause
Individual units of work analyzed for duration, status codes, and attribute completeness. When something goes wrong, OpsPilot traces it back to the exact span — and the exact service — that caused it. Root cause in plain English, not a list of correlated alerts.
Observability gap detection
OpsPilot analyzes your OpenTelemetry coverage itself — identifying services with missing instrumentation, critical flows with incomplete trace propagation, and spans missing essential attributes. Two decades of APM experience encoded into gap detection that finds blind spots before they cause incidents.
Cost and waste detection
Your OpenTelemetry data also reveals cost inefficiencies — over-provisioned Kubernetes pods, Lambda functions with provisioned concurrency and zero invocations, log verbosity waste, and redundant trace sampling at excessive rates. OpsPilot surfaces these alongside reliability findings.
Setup in minutes
Connect your OpenTelemetry pipeline — get AI SRE action
No new agents. No data migration. No rip-and-replace of your existing stack. If you're already sending telemetry via OTLP, you're 90% of the way there.
Point your OTLP pipeline at OpsPilot
Add OpsPilot as an OTLP exporter in your OpenTelemetry Collector config. One endpoint, all four signal types. No new agents, no proprietary SDKs, no changes to your existing instrumentation. Teams running Grafana and Prometheus connect in the same way.
AI SRE starts analyzing immediately
Your AI Coworker begins watching your stack from the moment data flows in — learning your baseline across all signal types, correlating metrics, logs, and traces simultaneously, and detecting deviations before alerts fire. Continuous AI incident investigation, 24/7.
Findings delivered to your team
Root cause, recommended fix, and a complete runbook appear in Slack, Microsoft Teams, or wherever your team works — before anyone opens a dashboard. Not a list of correlated alerts. An answer, with context, in plain English.
Proactive gap recommendations
OpsPilot analyzes your OpenTelemetry coverage continuously — surfacing services with missing instrumentation, critical paths with incomplete traces, and alerting blind spots. Your stack improves over time, not just your incident response.
Health scoring tracks progress
A 0–100 health score for your entire observability stack — updated continuously as OpsPilot analyzes your OpenTelemetry data. Measure improvement over time. Show leadership that reliability is getting better, with data to back it up.
Move toward autonomous operations
As your team acts on AI SRE recommendations, OpsPilot builds operational memory. Recurring issues are recognized faster. Recommendations sharpen. The path from reactive OpenTelemetry data collection to autonomous reliability operations becomes measurable and achievable.
OpsPilot adds AI SRE intelligence to your existing OpenTelemetry data — your instrumentation stays exactly as it is.
No rip-and-replace
OpenTelemetry-native — works with every major stack
OpsPilot connects to any OpenTelemetry-compatible source. Keep Grafana for dashboards, Prometheus for metrics scraping, and your existing alerting — OpsPilot adds AI SRE investigation on top, not instead of what you have. For a deeper look at why OpenTelemetry data alone isn't enough, read OpenTelemetry without intelligence is just expensive data collection.
Already using Datadog or New Relic? OpsPilot works alongside those platforms or replaces them entirely — delivering OpenTelemetry-native AI SRE capabilities at 60–70% lower cost. The choice is yours and there is no disruption either way. Compare costs — no form, no sales call.
G2 reviews — 169 verified
What engineering teams say about OpsPilot
9.7/10 for support. 9.0/10 for ease of setup. Higher scores than Datadog, New Relic, Splunk, Grafana, and Sentry across every G2 satisfaction category.
"OpsPilot surfaces exactly what needs attention — the AI suggestions are genuinely useful, not just noise. We've cut the time our team spends on investigation by nearly half."
Vinay J
Head of Platform Engineering
"The AI support is genuinely useful — it helps narrow down errors fast and tells you what to fix, not just what broke. It's the difference between a dashboard and an actual teammate."
Rene H
SRE Lead
"The AI capabilities are straightforward to use, and the support team ensures an excellent experience from day one. Setup took less than an afternoon and we were getting value immediately."
Brandon B
Director of IT Operations
Common questions
OpenTelemetry and OpsPilot — frequently asked questions
OpsPilot ingests all four OpenTelemetry signal types — metrics, logs, traces, and spans — via the standard OTLP protocol. It continuously cross-correlates those signals to identify root cause, detect performance issues, surface observability gaps, and deliver prioritized recommendations to Slack, Microsoft Teams, or wherever your team works. No new agents are required. If you're already sending OTLP data, you connect OpsPilot in minutes.
No. OpsPilot connects via the standard OpenTelemetry OTLP endpoint — it receives data from your existing OpenTelemetry Collector or any OTLP-compatible source. There is no proprietary agent to install and no changes required to your existing instrumentation. Teams using Grafana, Prometheus, or any OTel-compatible stack connect without disruption.
Yes — and this is the most common setup. OpsPilot connects to your existing OpenTelemetry pipeline and adds AI SRE investigation on top of the stack you already have. Keep Grafana for dashboards, keep Prometheus for metrics scraping, keep your existing alerting — OpsPilot adds the intelligence layer that tells your team what to do, not just what broke. No rip-and-replace required at any stage.
OpsPilot supports all four core OpenTelemetry signal types: metrics (counters, gauges, histograms), logs (structured and unstructured), traces (distributed end-to-end request journeys), and spans (individual units of work with attributes, events, and status codes). It cross-correlates all four simultaneously — which is where the AI SRE investigation capability comes from. Single-signal tools can alert you to a problem. OpsPilot correlates across all signals to find the cause.
Yes — OpsPilot delivers OpenTelemetry-native AI SRE capabilities at 60–70% lower cost than Datadog, Dynatrace, or New Relic. For teams already using OpenTelemetry, the comparison is particularly clear: you're already collecting the data via an open standard — you don't need a proprietary vendor's ingestion costs on top. OpsPilot adds the AI intelligence layer at a fraction of the cost. The pricing page includes a live comparison calculator — no form, no sales call.
OpenTelemetry-native AI SRE means AI Site Reliability Engineering built specifically around the OpenTelemetry standard — not retrofitted onto a proprietary agent or monitoring tool. OpsPilot was designed from the ground up to ingest OTLP data, reason across all four signal types simultaneously, and deliver AI SRE action. This is distinct from legacy AIOps tools that process event streams, and from observability platforms that visualize data but don't investigate it. Learn more about what is AI SRE.
Most teams are connected and receiving AI SRE insights within minutes. Add OpsPilot as an OTLP exporter in your OpenTelemetry Collector config — one endpoint, all signal types. No new agents, no data migration, no professional services required. Start a free trial or book a demo to see it working with your own OTLP data.
Your OpenTelemetry data deserves an AI SRE teammate
You've instrumented your stack with OpenTelemetry. Now add the intelligence layer that tells your team what to fix — before they open a dashboard. Built on two decades of APM experience across thousands of production incidents.
No credit card required · Live within minutes · See pricing — no form, no sales call
OpsPilot is the AI SRE teammate for teams using OpenTelemetry, Prometheus, Grafana, and existing observability stacks — helping engineers investigate incidents, find root cause, and move toward autonomous operations without replacing their tools. OpsPilot, formerly FusionReactor Cloud, is Intergral's AI-powered observability and AI SRE platform.