
OpenTelemetry Without Intelligence Is Just Expensive Data Collection
OpenTelemetry is not free.
The SDKs are open source. The protocol is open source. The specification is open source. But the engineering time to instrument your services, configure your collectors, maintain your pipelines, and store the data that flows through them — that is not free. Not by a long way.
A mid-sized engineering team running a properly instrumented OpenTelemetry stack is spending real money. On compute for collectors. On storage for metrics, logs, and traces. On the backend platform that receives and indexes the data. On the engineering time to maintain the instrumentation as services evolve.
The question that most teams don’t ask clearly enough is: what return are we getting on that investment?
OpenTelemetry intelligence — the ability to automatically analyze the telemetry data being collected and surface actionable insights from it — is what turns that investment from a cost center into a value driver. Without it, OpenTelemetry is an extraordinarily capable data collection system delivering data that sits largely unexamined until something breaks.
The Collection and Storage Problem
OpenTelemetry solves a genuinely hard problem. Getting consistent, vendor-neutral telemetry out of a distributed system — across different languages, different runtimes, different deployment models — is technically complex, and OpenTelemetry does it well. As we explored in Why OTLP Is Becoming The Universal Language of Observability, the protocol has reached a level of maturity and adoption that makes it the clear standard choice for any new instrumentation work.
But collection and storage are not the same as value. They are a prerequisite for value. The value comes from what happens after the data is collected.
For most teams, what happens after collection is: the data goes into a backend, dashboards get built, alerts get configured, and engineers look at it when something breaks. This is reactive observability. It uses a fraction of the analytical potential that OpenTelemetry data contains.
The intelligence gap in observability — the space between data collection and genuine operational insight — is where the return on OpenTelemetry investment gets lost.
What OpenTelemetry Data Actually Contains
To understand why the intelligence layer matters, it helps to be specific about what OpenTelemetry telemetry actually contains when a system is properly instrumented.
Metrics tell you the performance characteristics of every component in your system — latency distributions, error rates, resource utilization, request volumes, database connection counts, cache hit ratios. They are time-series data, which means they contain trend information that is invisible if you only look at current values.
Logs tell you what happened and when — events, errors, state changes, transaction records. Structured logs contain queryable fields that make it possible to correlate events across services when something goes wrong.
Traces tell you the path of every request through your system — which services it touched, how long each hop took, where errors occurred, what the dependency chain looked like. A complete distributed trace is one of the most powerful diagnostic tools available in modern software operations, as detailed in Beyond The Three Pillars: Why Unified Telemetry Is The Backbone of AI Observability.
This combination — metrics, logs, and traces — gives an intelligence layer everything it needs to understand the behavior of a system, detect anomalies, identify patterns, and surface recommendations. The data is there. The question is whether anything is using it analytically.
Already sending OTLP data? OpsPilot connects to your existing pipeline in minutes and starts finding what the data has been trying to tell you. Start your free trial at app.opspilot.com/sign-up
The Reactive vs Proactive Problem
The fundamental limitation of OpenTelemetry without an intelligence layer is that it produces reactive observability rather than proactive observability.
Reactive observability means: something breaks, an alert fires, an engineer investigates using the available telemetry, root cause is found, fix is applied. The telemetry is used as a diagnostic tool after the fact.
Proactive observability means: the telemetry is continuously analyzed, patterns that precede failures are detected before they become incidents, recommendations are surfaced to the team before anything breaks. The telemetry is used as an early warning system.
As we wrote in Your Observability Stack Is Missing Layer 3, the industry has built excellent tooling for layers one and two — collection and visualisation. Layer three — the intelligence layer — is what most teams are missing.
The difference in practice is significant. A team with reactive observability discovers that the connection pool on their payment service was at 94% utilisation when the service started timing out at peak load. A team with proactive observability receives a recommendation three days earlier that the connection pool is trending toward saturation and should be increased before the next traffic peak.
Both teams had the data. Only one was using it continuously.
What The Intelligence Gap Costs
The cost of operating OpenTelemetry without an intelligence layer is real but often invisible because it accumulates gradually rather than appearing as a single line item.
Incident cost. Every incident that could have been caught proactively but wasn’t has a cost — engineer time, user impact, recovery effort. For a team handling eight significant incidents per month, each with an average root cause analysis time of three hours, the monthly cost in engineering time alone is substantial. We covered this in detail in You Have 10,000 Metrics. Why Does Root Cause Still Take 3 Hours?
Optimization cost. OpenTelemetry metrics contain cost signals — over-provisioned resources, unused allocations, inefficient patterns — that accumulate into budget waste when nobody is examining them systematically. The average team has meaningful cloud cost waste detectable in their existing telemetry. Without an intelligence layer scanning for it continuously, it stays hidden.
Coverage cost. OpenTelemetry instrumentation is rarely perfect. Services get instrumented quickly, trace propagation gets missed, database calls go untraced. These gaps are invisible until an incident exposes them. An intelligence layer that evaluates instrumentation coverage continuously finds these gaps before they matter — as we describe in See How Your Services Connect: Introducing Services In OpsPilot.
Opportunity cost. Engineering time spent on manual dashboard analysis is engineering time not spent on product work. The opportunity cost of maintaining reactive observability — the time engineers spend looking at dashboards, investigating alerts, performing manual triage — is a constant drag on engineering capacity.
What Intelligence Looks Like In Practice
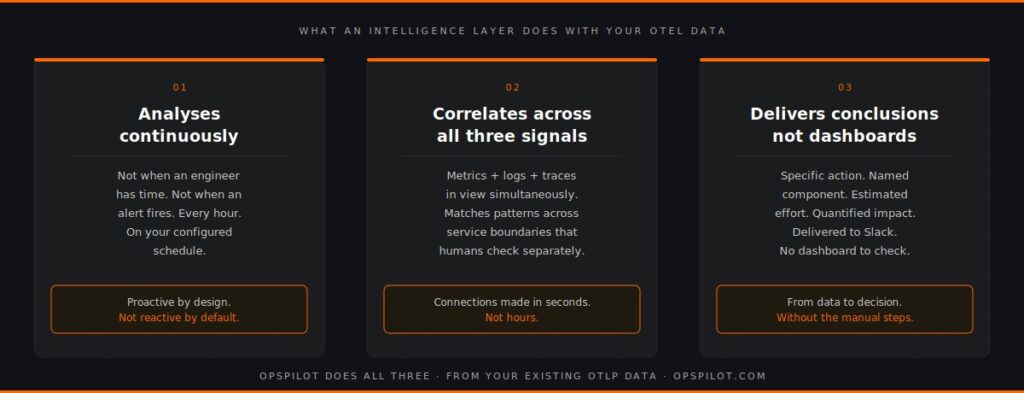
An intelligence layer operating on OpenTelemetry data does three things that reactive observability cannot.
First, it analyses continuously. Not when an engineer has time to check dashboards, not when an alert fires. Every hour, or every day, or on whatever schedule the team configures, the intelligence layer examines the full dataset and asks systematic questions of it. Are any trends moving in a direction that precedes known failure patterns? Are there cost anomalies in the resource utilization data? Is instrumentation coverage complete enough to support root cause analysis if an incident occurred?
Second, it correlates across signals. The intelligence gap between collection and insight is largely a correlation problem. Metrics, logs, and traces each tell part of the story. Connecting them — realizing that the latency increase in the metrics, the timeout errors in the logs, and the slow database calls in the traces are all symptoms of the same connection pool problem — requires something that can hold all three datasets in view simultaneously and match the pattern against known failure signatures.
Third, it delivers conclusions rather than data. The output of an intelligence layer is not another dashboard. It is a prioritized recommendation with a specific action, an estimated effort, and a quantified business impact. “Connection pool exhaustion detected on payment-service. Increase pool size from 20 to 35. Estimated effort: 15 minutes. Risk if unaddressed: service timeout at next traffic peak.” That is a different kind of output from a latency graph.
This is what OpsPilot delivers to Slack — on your schedule, from your existing OpenTelemetry data, without new agents or instrumentation changes. The intelligence layer your OTLP pipeline is currently missing.
The ROI Question
If you are spending money on OpenTelemetry infrastructure — collectors, storage backends, platform costs — the relevant question is whether you are getting the full return on that investment.
Collection and storage without intelligence is like investing in a high-quality library and never reading the books. The infrastructure is there. The value requires something that actively engages with the content.
Adding an intelligence layer to your existing OpenTelemetry stack does not require replacing anything. It does not require re-instrumenting services. It does not require migrating data. OpsPilot connects to your existing OTLP endpoint — the same one your data is already flowing through — and begins analysing from there.
The return is measurable. Reduced incident frequency from proactive pattern detection. Reduced root cause analysis time from automated correlation. Reduced cloud waste from continuous cost signal analysis. Improved observability coverage from automated gap detection. A health score that tracks improvement over time and gives engineering leadership a reportable metric for operational progress.
You can see how OpsPilot compares to your current observability spend at opspilot.com/pricing — no form, no sales call.
The Uncomfortable Truth About Reactive Observability
There is a version of this conversation that engineering teams avoid having, because the conclusion is uncomfortable.
If your team is operating OpenTelemetry in fully reactive mode — data collected, dashboards built, alerts configured, investigation happens when things break — you are using a small fraction of what the data can tell you. The early warning signals are in the telemetry. The cost waste is in the metrics. The instrumentation gaps are visible in the coverage analysis. None of it is reaching your team.
This is not a failure of your tools. Grafana and Datadog and your other platforms are doing what they were designed to do. It is the absence of a layer above them that was never designed into the original observability stack model, because it required capability that wasn’t available when that model was established.
As we explored in Don’t Buy An AI-Native Black Box, the answer is not to replace your stack with something opaque. It is to add a transparent intelligence layer that works with your existing telemetry, explains its reasoning, and gives your team prioritized actions rather than black-box outputs.
OpenTelemetry gives you the data. The intelligence layer gives you the return on it.
FAQ
Does adding an intelligence layer mean replacing our existing observability backend? No. OpsPilot receives your OpenTelemetry data via OTLP alongside your existing backend — Grafana, Datadog, or any other platform. You run both in parallel. Your existing dashboards and alerts continue to work. OpsPilot adds the analytical layer on top of the same data stream.
How much of the ROI from OpenTelemetry are most teams actually capturing? In our experience working with engineering teams, most are capturing the reactive value — the ability to investigate incidents using telemetry — but missing the proactive value entirely. That means early warning detection, cost optimization, and continuous gap analysis are left on the table. The proactive value is typically larger than the reactive value once it’s running.
What if our OpenTelemetry instrumentation isn’t complete? OpsPilot analyses whatever signals it receives and flags coverage gaps as part of gap detection. Incomplete instrumentation reduces the depth of analysis available for affected services but doesn’t prevent analysis of the services that are properly instrumented. The gap detection output itself helps teams prioritize instrumentation improvements that will have the most impact on observability quality.
How quickly does the intelligence layer start delivering value? OpsPilot begins delivering recommendations within 24 hours of connecting to your OTLP endpoint. The first week establishes baselines for your specific traffic patterns and service behavior, which improves the accuracy of pattern detection. Most teams see their first actionable recommendation — typically a cost optimization or a performance pattern worth addressing — within the first analysis cycle.
Your OpenTelemetry data is collecting the answers. Something needs to read them.
Start your free trial at app.opspilot.com/sign-up
Or see how OpsPilot compares to your current observability spend: opspilot.com/pricing — no form, no sales call
OpsPilot is an AI-powered observability intelligence platform that continuously analyses your OpenTelemetry data and delivers prioritized recommendations, health scoring, and gap detection — directly to Slack. Built by APM engineers with two decades of experience.