
You Have 10,000 Metrics. Why Does Root Cause Still Take 3 Hours?
Here is a number worth sitting with.
The average engineering team running a modern production system has somewhere between 5,000 and 15,000 active metrics at any given moment. Service latency, error rates, request throughput, database query times, cache hit ratios, memory utilization, CPU load, disk I/O — across every service, every instance, every environment.
And when something goes wrong, a senior engineer still sits down, opens a set of dashboards, and manually works through that data to find the cause.
It takes, on average, between two and four hours.
Not because the engineer is slow. Not because the tools are bad. Because finding root cause in a distributed system is a correlation problem, and correlation at scale is genuinely hard to do manually.
The question worth asking in 2026 is not “how do we help engineers investigate faster?” It is “Why are engineers still doing the investigation at all?”
The Root Cause Analysis Time Problem
Root cause analysis time — the time from when an incident is detected to when its cause is identified — is one of the most consequential metrics in engineering operations. It drives MTTR. It determines how long users experience degradation. It dictates how much of the on-call engineer’s night gets consumed by investigation rather than remediation.
And despite two decades of investment in observability tooling, root cause analysis time has not meaningfully improved for most teams.
The tools have improved. The data volumes have increased. The dashboards have multiplied. The root cause analysis time has stayed roughly constant.
This is not a coincidence. It is a structural problem.
Why More Metrics Doesn’t Mean Faster Root Cause Analysis
There is an intuitive assumption that more observability data should lead to faster root cause analysis. If you can see everything, surely you can find the problem faster.
The assumption is wrong. And understanding why it’s wrong is the key to actually reducing root cause analysis time. As we explored in The Intelligence Gap in Observability: Why More Data Isn’t The Answer, the problem has never been the volume of data — it’s the absence of a layer that interprets it.
More metrics means more signal. But it also means more noise. And the ratio of signal to noise in a typical observability stack does not improve as the stack grows — it often gets worse.
Consider what happens when an incident fires on a 30-service application. An alert triggers. An engineer opens their monitoring tool. They are presented with dashboards showing metrics for dozens of services, each with dozens of metric types. Some metrics are elevated. Some are elevated because of the incident. Some are elevated for unrelated reasons. Some are within normal range but trending in a direction that matters. Some are completely irrelevant.
The engineer’s job, under pressure, is to separate the signal from the noise in real time, build a mental model of what’s connected to what, follow the dependency chain to the root cause, and do all of this in a system they may not have looked at in detail for days or weeks.
This is cognitively demanding work. It does not get easier because there are more metrics. It gets harder.
The Three Reasons Root Cause Analysis Takes So Long
When you look at incident timelines across many different teams and many different stacks, root cause analysis time breaks down into three consistent phases:
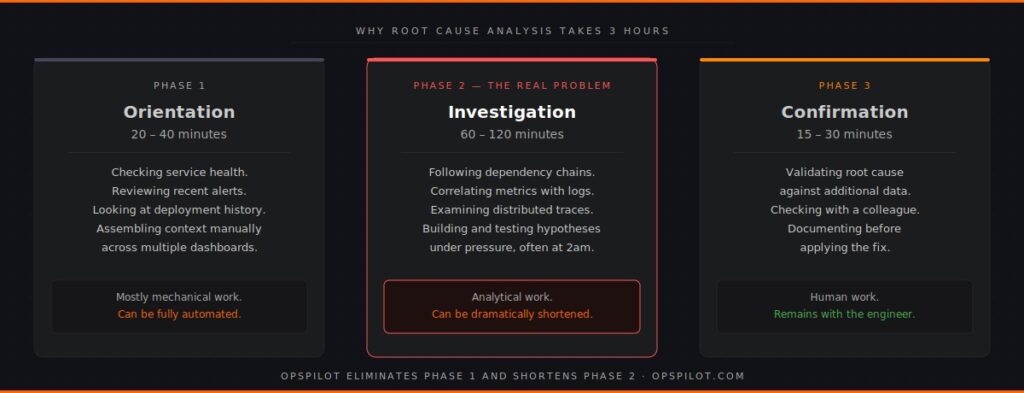
Phase 1: Orientation (20-40 minutes)
The engineer has been paged. They’re looking at a monitoring tool. They need to understand what is happening before they can start investigating why.
This phase involves checking service health dashboards, reviewing recent alerts, scanning error rates, looking at deployment history. It is largely mechanical work — gathering context that should be available instantly but rarely is in a single view.
The time this takes is almost entirely determined by how well the monitoring tooling surfaces context automatically. Most tools require the engineer to manually assemble the context.
Phase 2: Investigation (60-120 minutes)
This is the core of root cause analysis time. The engineer has orientation — they know which services are affected, roughly when the problem started, and what the symptoms look like. Now they need to find the cause.
Investigation involves following dependency chains across services, correlating metrics with logs, examining distributed traces, cross-referencing deployment events with performance changes, and ruling out potential causes one by one. The 7 patterns behind 95% of production failures are all identifiable from this data — but only if you know what to look for and where.
This phase takes as long as it takes because it is genuinely analytical work. The engineer is building a hypothesis, testing it against the data, revising the hypothesis, and repeating. Distributed traces — when coverage is complete, as explored in Beyond The Three Pillars: Why Unified Telemetry Is The Backbone of AI Observability — are the most powerful tool available in this phase. But only if something is correlating them against the other signals automatically.
For a senior engineer who knows the system well, this might take 45 minutes. For a less experienced engineer on call at 2am for a service they don’t own, it might take three hours.
Phase 3: Confirmation (15-30 minutes)
Once the likely root cause is identified, it needs to be confirmed — checked against additional data, validated with a colleague, documented before the fix is applied.
This phase is relatively quick but adds to the total root cause analysis time and is where mistakes get made under time pressure.
OpsPilot does the Phase 1 and Phase 2 work for you — automatically, before the incident fires. Start your free trial at app.opspilot.com/sign-up
What Actually Reduces Root Cause Analysis Time
Given that three-phase breakdown, the interventions that actually reduce root cause analysis time become clear.
Phase 1 can be almost entirely eliminated. Orientation — gathering context, identifying affected services, understanding the timeline — is mechanical work that can be automated. If something is continuously analyzing your observability data and building that context automatically, the engineer arrives at an incident with the orientation work already done. Time to Phase 2: near zero.
Phase 2 can be dramatically shortened. Investigation — correlation, hypothesis testing, dependency chain analysis — can be assisted by a system that already knows your service topology, already understands normal behavior patterns, and can match incoming signals against known failure patterns in seconds rather than hours. This is Layer 3 of the observability stack — the intelligence layer that most teams are still missing. The engineer’s role shifts from investigator to decision-maker.
Phase 3 remains human. Confirming and documenting root cause is appropriately a human task. But it takes 15-30 minutes regardless of how the first two phases went.
The implication is stark. A team that eliminates Phase 1 and shortens Phase 2 from 90 minutes to 15 minutes reduces average root cause analysis time from three hours to under 45 minutes. Not through better dashboards. Not through more metrics. Through continuous automated analysis that does the correlation work before an engineer needs to.
The Alert Fatigue Connection
Root cause analysis time and alert fatigue are two sides of the same problem.
Alert fatigue — the gradual numbing of engineers to alerts because there are too many and most are not actionable — directly extends root cause analysis time in two ways.
First, it delays detection. When alert noise is high, critical alerts get lost in the queue. Incidents that could have been caught at 30 minutes of impact get caught at two hours.
Second, it degrades investigation quality. Engineers who have spent months responding to noisy alerts develop a pattern of rapid triage — quick checks, low attention to detail — that works for the 90% of alerts that resolve quickly and fails badly for the 10% that require genuine investigation.
Reducing root cause analysis time requires reducing alert fatigue. And reducing alert fatigue requires something that distinguishes signal from noise before it reaches the engineer, which is, again, an analytical layer running continuously on the underlying data. The teams getting this right in 2026 are those where the observability stack tells them what to fix — not just what broke.
What A Reduced Root Cause Analysis Time Means In Practice
The business case for reducing root cause analysis time is straightforward but rarely quantified clearly.
Every hour of reduced root cause analysis time per incident translates directly into reduced user impact, reduced on-call burden, and reduced engineering time spent on incident response rather than product work.
For a team that handles eight significant incidents per month, reducing average root cause analysis time from three hours to 45 minutes saves roughly 18 hours of senior engineering time per month. That is half a week of engineering capacity, per month, recovered for product work.
It also has a compounding effect on team health. The on-call experience for engineers shifts from long, frustrating investigations at unsociable hours to shorter, more structured response processes. Burnout risk from on-call reduces. Confidence in the system increases.
And it has a direct relationship with health scoring. OpsPilot tracks root cause analysis time improvement as part of stack health scoring — giving engineering leaders a measurable, reportable metric that shows operational improvement over time. Not anecdotal. Tracked. You can see the full picture of how your services connect and where the gaps are in OpsPilot’s services view, and compare the cost of your current stack against OpsPilot at opspilot.com/pricing — no form, no sales call.
Why This Problem Is Solvable Now
The reason root cause analysis time has been stubbornly resistant to improvement for two decades is that the solution required capability that wasn’t available until recently.
Reducing root cause analysis time through automated analysis requires a system that understands your specific service topology, knows what normal looks like for your traffic patterns, can match real-time signals against known failure patterns at speed, and can surface prioritized recommendations in a way that reaches engineers without requiring them to check yet another tool.
All of that is achievable today from existing OpenTelemetry data, without proprietary agents, without changes to existing instrumentation, and without a multi-month implementation project.
OpsPilot ingests your OTLP data, establishes baselines for your specific services over the first week, and starts surfacing pattern matches and prioritized recommendations to Slack on your configured schedule. The orientation phase of incident response starts arriving in your team’s Slack channel before incidents fire. The investigation phase gets a head start before an engineer opens a single dashboard.
Root cause analysis time does not have to take three hours. The data to reduce it is already in your stack.
FAQ
Why hasn’t more observability data reduced root cause analysis time? Because root cause analysis is a correlation problem, not a visibility problem. More metrics increase the volume of data to search through without improving the ability to connect signals across services automatically. Reducing root cause analysis time requires automated correlation, not more data collection.
What is a realistic root cause analysis time target for a mid-sized engineering team? Teams with good observability coverage and an intelligence layer doing automated correlation should target under 45 minutes for the majority of incidents. The fastest teams — those with well-established baselines and continuous pattern detection — are consistently under 20 minutes. Starting from three hours, most teams see meaningful improvement within the first month of running automated analysis.
How does OpsPilot reduce root cause analysis time specifically? OpsPilot eliminates the orientation phase of incident response by delivering pre-built context — affected services, timeline, correlated signals — before the engineer starts investigating. It shortens the investigation phase by matching incoming signals against known failure patterns and surfacing the most likely root cause with supporting evidence. Engineers arrive at confirmation faster because the hypothesis is already formed.
Does OpsPilot work alongside existing alerting tools? Yes. OpsPilot delivers recommendations to Slack independently of your existing alerting pipeline. It doesn’t replace PagerDuty or your existing alert routing — it adds a layer of analytical context that means when an alert does fire, the engineer receiving it already has more information to work with.

Root cause analysis doesn’t have to take three hours. The data to reduce it is already in your stack.
OpsPilot is an AI-powered observability intelligence platform that continuously analyses your OpenTelemetry data and delivers prioritized recommendations, health scoring, and gap detection — directly to Slack. Built by APM engineers with two decades of experience.