
Distributed Tracing in 2026: Why Your Observability Platform Is Only Using Half of What It Can Tell You
Distributed tracing is one of the most powerful signals in your observability platform — and most teams use it for one thing: finding out what went wrong after an incident has started.
The pattern is familiar. An alert fires. An engineer opens their tracing tool, searches for traces from the affected service in the incident window, follows the span chain to the slow dependency, identifies the bottleneck. The trace told them exactly what they needed to know — 45 minutes into the incident investigation.
This is not a bad use of distributed tracing. It is a partial one. The trace that identified the slow downstream dependency during the incident was generating the same signal for hours before the alert fired. The latency was increasing incrementally. The span durations were trending upward. The dependency error rate was climbing. All of this was in the traces. Nobody was watching.
This is the half of distributed tracing that most observability platforms don’t use: the continuous analytical intelligence that watches trace patterns across all services simultaneously and surfaces the degrading dependency, the anomalous span, the emerging error rate — not when an engineer runs a query, but when the pattern first becomes visible in the telemetry.
This post is about what using the full capability of distributed tracing looks like in 2026, and what an AI site reliability engineering (SRE) observability platform adds to a stack that already has traces flowing through OpenTelemetry.
What Distributed Tracing Does — and the Gap It Leaves
Distributed tracing provides request-level visibility across service boundaries. A single user request enters your system, propagates through multiple services, generates a span at each hop, and produces a complete trace that shows exactly where time was spent, where errors occurred, and which services contributed to the total request latency.
For teams that have invested in OpenTelemetry instrumentation and have traces flowing from all services through a unified OTLP pipeline, this visibility is genuinely powerful. Following a slow request across 12 service boundaries and identifying that 94% of the latency was in a single database query is a capability that was impossible without distributed tracing and difficult to replicate with any other signal type.
As we covered in OpenTelemetry Maturity, teams at Stage 2 and above — with unified OTLP and distributed traces — have the foundation for sophisticated observability. What they typically lack is the analytical layer that watches those traces continuously rather than waiting to be queried.
What the trace data can tell you that nobody’s asking for
Within a complete distributed trace dataset, several categories of pattern are analytically detectable that are not currently surfaced by most observability platforms:
Span duration trends by service. If the average span duration for a specific service is increasing by 3% per hour over a 12-hour window, that trend is visible in the trace data before it crosses any alert threshold. It is also not visible to anyone unless they are specifically querying for it — which they are not, because they do not know there is a problem yet.
Dependency error rate changes. A downstream service beginning to return errors on 0.3% of requests is below every alert threshold set for it. It is also visible in traces from every upstream service that calls it. The pattern of distributed impact — 14 upstream services all showing marginal error rate increases tracing back to a single dependency — is identifiable from trace data before any individual service crosses an alert threshold.
Trace topology changes. When a new code path appears in traces — a new service hop, a different database call pattern, an additional external API call — it is visible as a structural change in the trace topology. Service topology changes often precede reliability impacts; catching them as patterns rather than waiting for them to produce failures is a meaningful capability.
Cold start and initialization patterns. In containerized environments, trace data captures service initialization latency that appears after deployments and scaling events. These patterns are predictable from trace data and catchable before they produce customer-visible degradation.
None of these require trace data that teams don’t already have. They require continuous analysis of trace data that most observability platforms do not provide.
What an AI SRE Observability Platform Adds to Distributed Tracing
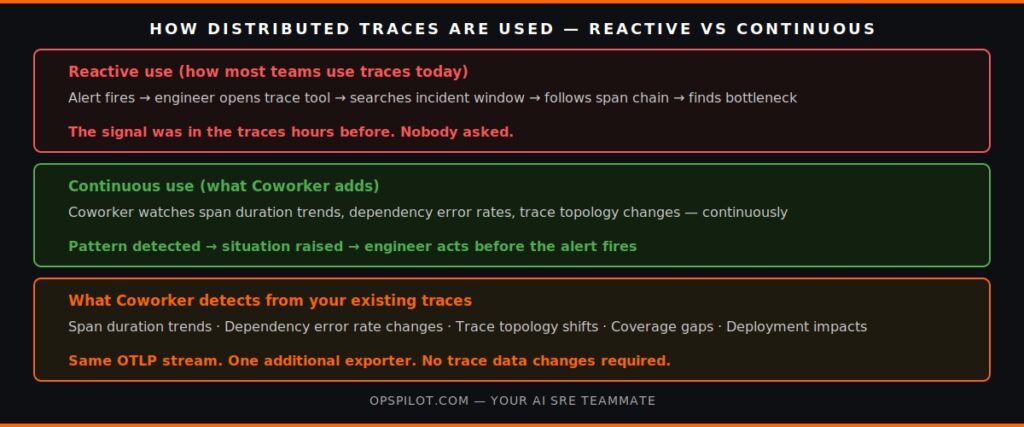
Adding OpsPilot’s Coworker to a stack with distributed tracing already flowing through OTLP does not change the trace pipeline. Your existing Tempo, Jaeger, or other trace backend continues to receive the same telemetry. Coworker receives the same OTLP stream as an additional consumer and analyzes it continuously alongside metrics and logs.
What changes is that between engineer sessions, someone is watching the traces.
Continuous span duration monitoring. Coworker tracks span duration baselines per service and per operation type. When a specific operation’s p95 span duration begins trending upward — not crossing a threshold, but trending — Coworker surfaces a watching situation. The engineer can investigate proactively or monitor the trend. If it crosses into warning territory, the situation severity escalates. If it resolves naturally, the situation closes without requiring manual triage.
Cross-service correlation from trace data. When a downstream service begins exhibiting latency or error rate changes, Coworker identifies the upstream services affected through their traces and surfaces a correlated situation — not one situation per affected service, but a single situation that names the root dependency and lists the downstream impact. This is the cross-service correlation that manual trace investigation produces after 45 minutes of work, available before the alert fires.
Deployment impact detection. When a deployment produces a measurable change in trace topology or span duration distributions — even within normal alert thresholds — Coworker surfaces this as a situation with the deployment as the likely contributing factor. Teams can investigate and validate proactively rather than discovering the deployment impact during the next incident.
Gap detection in trace coverage. Coworker identifies services that are present in your OTLP metrics but absent from your traces — indicating incomplete instrumentation. These coverage gaps are surfaced as situations with specific service names, allowing instrumentation to be prioritized against the services most likely to be involved in incidents. As we covered in Grafana AI SRE, incomplete coverage limits both your Grafana dashboards and your Coworker detection — closing the gaps improves both.
For Kubernetes environments, trace data from application services is correlated with infrastructure-level signals from the cluster. A span duration increase on a service is analysed alongside the node and pod context from which the service is running — identifying whether the application behavior is driven by infrastructure pressure or application logic. As we covered in Kubernetes Observability, this cross-layer correlation is one of the most significant capabilities that AI SRE adds to K8s environments.
Ready to use the full capability of your distributed traces? Start your free trial at app.opspilot.com/sign-up — no credit card required.
Getting More From the Traces You Already Have
For teams that have already invested in OpenTelemetry distributed tracing, the path to getting more value from that investment does not require additional instrumentation. It requires an analytical layer that watches the traces continuously.
Three things that improve the value of existing trace data immediately:
Ensure trace context propagation is complete. Traces that break at service boundaries — where the trace ID is not propagated from one service to the next — produce incomplete pictures. An incomplete trace cannot identify the root cause if the root cause is in a service that doesn’t receive the trace context. Coworker’s coverage gap situations identify broken propagation chains specifically, making the fix tractable.
Confirm sampling rates are appropriate. High-traffic services with aggressive trace sampling may be missing the long-tail requests that reveal the most about latency distribution. A service sampling at 1% and averaging 10ms per request is effectively invisible at the p99 level where latency issues first appear. Coworker’s analysis of span duration distributions can identify where sampling is suppressing signal that would otherwise be detectable.
Add structured attributes to spans. Spans with rich structured attributes — user segment, feature flag, deployment version, geographic region — enable Coworker to identify patterns that correlate with these dimensions. A latency increase affecting only users in a specific region, or only requests with a specific feature flag enabled, is identifiable from structured span attributes in a way that it isn’t from bare span duration data.
For the foundational context on how trace data fits into the broader OTLP pipeline, see the distributed tracing page and the OpenTelemetry page. For pricing — no form, no sales call.
Frequently Asked Questions
No. Coworker connects to your OTLP pipeline as an additional trace consumer — your existing Tempo, Jaeger, Zipkin, or other trace backend continues to receive traces as before. Coworker receives the same OTLP stream in parallel and analyzes it continuously. Nothing changes for your existing trace query and investigation tooling.
Coworker analyzes trace patterns continuously rather than storing raw trace data. When Coworker surfaces a situation based on a trace pattern, the situation includes the relevant context — affected service, span operation, duration trend, correlated signals — but the full raw trace is available in your existing trace backend for detailed investigation. This means you are not duplicating trace storage costs.
High-cardinality span attributes — user IDs, request IDs, session tokens — are recognized and handled appropriately in Coworker's analysis. Coworker focuses on the attributes that produce meaningful operational patterns (service name, operation name, HTTP status, database query type) rather than high-cardinality identifiers that don't aggregate meaningfully. For specific patterns involving high-cardinality attributes, OpsPilot Chat can be used to query directly.
Coworker provides value proportional to instrumentation completeness — the more services traced, the more complete the cross-service correlation. However, even partial coverage is useful. Coworker surfaces situations for the services that are instrumented, identifies coverage gaps for the services that aren't, and provides a prioritized instrumentation roadmap based on which untraced services are most likely to be involved in incidents. Starting with partial coverage and completing instrumentation progressively is a common and effective adoption path.
Use the full capability of your distributed traces. Not just during incidents.
Start your free trial → app.opspilot.com/sign-up
Or talk it through: Book a demo → calendly.com/fusionreactor-sales/opspilot-demo
OpsPilot is the AI SRE teammate for teams using OpenTelemetry, Prometheus, Grafana, and existing observability stacks — helping engineers investigate incidents, find root cause, and move toward autonomous operations without replacing their tools. OpsPilot, formerly FusionReactor Cloud, is Intergral’s AI-powered observability and AI SRE platform.