
You’ve Instrumented Everything With OpenTelemetry. Now What?
OpenTelemetry has won. That much is settled.
The CNCF project has become the default standard for telemetry instrumentation across the industry. Most engineering teams adopting new services instrument with OpenTelemetry from day one. Legacy services are being migrated. OTLP — the OpenTelemetry protocol — is now a first-class citizen in every major observability platform.
If your team has been working through an OpenTelemetry adoption over the last year or two, you have probably reached a point where the instrumentation question feels largely answered. The SDKs are in place. The collectors are configured. Metrics, logs, and traces are flowing via OTLP to your backend of choice.
And then comes the question that OpenTelemetry itself doesn’t answer.
Now what?
The OpenTelemetry Next Steps Problem
OpenTelemetry is a telemetry standard. It defines how data is collected, what it looks like, and how it gets transported. It does this exceptionally well. The project has solved a genuinely hard problem — vendor-neutral, language-agnostic telemetry instrumentation that works across the entire modern software stack.
What it doesn’t define is what you do with the data once it arrives.
That question — the OpenTelemetry next steps question — is left entirely to the team. And for most teams, the answer has been: send it to a visualization backend, build some dashboards, configure some alerts, and hope that someone has time to check them regularly.
This is a reasonable answer. It is not a complete answer.
The data OpenTelemetry generates for your team is extraordinarily rich. Distributed traces that show the full path of a request across every service it touches. Metrics that capture the performance characteristics of every component. Logs that record the behavior of your application in production in real time.
All of that data is sitting in your backend right now. Most of it is never looked at unless something breaks.
What Most Teams Do With Their OpenTelemetry Data
The typical OpenTelemetry data flow for a mid-sized engineering team looks like this:
Services are instrumented, and data flows via OTLP to a backend — Grafana, Datadog, or a cloud-native option. Dashboards are built for the services that matter most. Alerts are configured for the thresholds that seem important. The team monitors the dashboards when they remember to, responds to alerts when they fire, and investigates incidents using the trace data when something goes wrong.
This is not wrong. This is how observability has always worked.
The problem is that it is reactive. The OpenTelemetry data is used as a diagnostic tool after problems occur, not as an analytical resource to prevent or detect them early.
And the volume of data that OpenTelemetry generates makes comprehensive manual analysis genuinely impossible. A 30-service application instrumented properly with OpenTelemetry will generate more telemetry data every hour than any engineer could meaningfully review in a day. The dashboard shows the surface. Beneath it, patterns are forming that nobody is watching.
Already sending OTLP data? OpsPilot connects to your existing OpenTelemetry pipeline in minutes. Start your free trial at app.opspilot.com/sign-up
The Three Things OpenTelemetry Data Can Tell You — If Something Is Analyzing It
The richness of OpenTelemetry data makes it capable of answering three categories of questions that most teams never systematically ask:
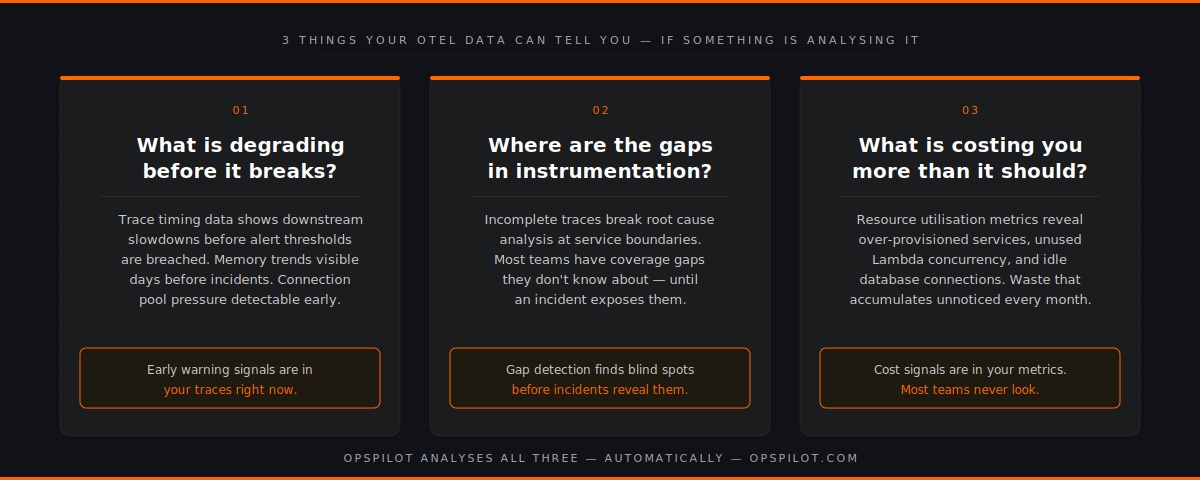
- What is degrading before it breaks?
Distributed traces carry timing information for every hop in a request path. When a downstream service starts slowing down, the trace data shows it immediately — long before latency on the dependent service crosses an alert threshold. Memory metrics show growth trends before incidents occur. Connection pool utilization indicates pressure before failures occur.
OpenTelemetry data is full of early warning signals. Most teams only see them in retrospect, looking back at traces during a post-mortem and noticing that the degradation was visible hours before the incident.
- Where are the gaps in your instrumentation?
OpenTelemetry traces are only useful for root cause analysis if they’re complete. A trace that breaks at a service boundary — because one service is instrumented and the one it calls isn’t — leaves a gap that turns a 15-minute diagnosis into a 3-hour investigation.
Most teams have gaps in their OpenTelemetry coverage that they don’t know about. Services that were instrumented quickly and incompletely. Database calls that aren’t being traced. External API calls that don’t propagate trace context. These gaps are invisible until an incident exposes them.
- What is this costing you that it shouldn’t be?
OpenTelemetry metrics include resource utilization data that, when analyzed systematically, reveals waste that accumulates unnoticed. Over-provisioned services running at 10% CPU. Lambda functions with provisioned concurrency that never get used. Database connections allocated but never consumed.
The cost optimization signal is in the metrics. It requires something to look at those metrics analytically rather than reactively.
Why The Visualization Backend Doesn’t Answer These Questions
Grafana, Datadog, and their peers are built to answer the question you ask. You open a dashboard, you look at the data you chose to visualize, and you get an answer.
They are not built to proactively ask questions on your behalf.
Nobody at Grafana is looking at your trace data and sending you a message saying, “This service has been getting slower for three days, and you should probably look at it.” Nobody is reviewing your instrumentation coverage and flagging that your checkout flow has incomplete trace propagation. Nobody is scanning your cost metrics and telling you which resources are wasting money.
Those things require an analytical layer that runs continuously, asks systematic questions of your OpenTelemetry data, and surfaces the answers in a way that reaches your team without requiring them to look for them.
That is not what visualization backends were designed to do. It is what an intelligence layer does.
The OpenTelemetry Next Steps That Most Teams Skip
When engineering teams consider OpenTelemetry next steps, they typically focus on coverage — instrumenting more services, adding more metric collection points, and extending trace propagation. This is valuable work.
But there is a more impactful next step that most teams skip, because it requires the capability they don’t have yet: making the data work for you automatically.
A complete OpenTelemetry implementation has two parts. The first part — which most mature teams have — is instrumentation and transport. The second part — which most teams lack — is continuous, automated analysis of the data produced by instrumentation.
Without the second part, the first part is an expensive data warehouse that gets queried reactively.
With the second part, it becomes a continuous monitoring system that surfaces problems before they become incidents, finds gaps before they cause blind spots, and identifies optimization opportunities before they accumulate into budget waste.
What Continuous Analysis Of OpenTelemetry Data Looks Like In Practice
OpsPilot ingests your existing OpenTelemetry data via OTLP — the same transport your data is already using to reach your visualization backend. No changes to your instrumentation. No new agents. No migration of data.
It then does three things continuously, on the schedule your team configures:
Pattern detection — analyzes your metrics, logs, and traces for the patterns that precede production failures. Connection pool pressure. Memory growth trends. Query latency increases. Upstream dependency degradation. These patterns are matched against known failure signatures and surfaced as prioritized recommendations before they become incidents.
Gap detection — systematically evaluates your OpenTelemetry instrumentation coverage. Identifies services with missing or incomplete traces. Flags database calls and external API calls where the trace context isn’t propagating. Surfaces the instrumentation gaps that would make root cause analysis harder if an incident occurred.
Health scoring — tracks the overall health of your stack across eight dimensions: observability maturity, error rate management, performance, alerting effectiveness, logging coverage, instrumentation quality, security posture, and cost efficiency. Each dimension gets a score from 0 to 100, with trend data showing whether you’re improving or declining over time.
All of this arrives in Slack. Not a dashboard to check. A digest that reaches your team, on your schedule, with prioritized recommendations and clear actions.
The Question Behind The Question
When engineering teams ask about OpenTelemetry next steps, they’re usually asking one of two things.
The first is technical: what else should we instrument, what backends should we use, how do we extend coverage?
The second — less often stated — is strategic: we’ve invested significantly in OpenTelemetry instrumentation, we know the data is valuable, but we’re not sure we’re getting the full value out of it. What are we missing?
The answer to the second question is almost always the same. The instrumentation is in good shape. The data is there. What’s missing is the analytical layer that makes the data work continuously rather than reactively.
OpenTelemetry gave you the data pipeline. The intelligence layer gives you the return on that investment.
FAQ
Do I need to change my OpenTelemetry instrumentation to use OpsPilot? No. OpsPilot connects to your existing OTLP endpoint. If your services are already sending data via OTLP — whether to Grafana, Datadog, or any other backend — OpsPilot can receive the same data without any changes to your instrumentation. You can run it alongside your existing backend.
What OpenTelemetry signals does OpsPilot analyze? OpsPilot analyses all three OpenTelemetry signal types: metrics, logs, and traces. The depth of analysis available for each service depends on the signals it emits — services with full metrics, logs, and traces get the most complete analysis. Services that emit only metrics receive cost and performance analysis. The gap detection capability will flag services where additional instrumentation would increase analysis coverage.
How quickly can OpsPilot start analyzing after connecting? Once your OTLP endpoint is configured, OpsPilot immediately starts receiving and analyzing data. The first analysis digest is delivered within 24 hours of connection. Pattern detection improves over the first week as OpsPilot establishes baselines for your specific services and traffic patterns.
What if we’re using a mix of OpenTelemetry and other instrumentation? OpsPilot’s primary ingestion path is OTLP. Teams using FusionReactor for deep JVM or ColdFusion telemetry can also connect to that data source directly, adding application-level depth to the analysis. Prometheus remote write is also supported for teams with existing Prometheus metric pipelines.
Already sending OTLP data? OpsPilot connects in minutes and starts finding what your data has been trying to tell you.
Start your free trial at app.opspilot.com/sign-up
OpsPilot is an AI-powered observability intelligence platform that continuously analyses your OpenTelemetry data and delivers prioritized recommendations, health scoring, and gap detection — directly to Slack. Built by APM engineers with two decades of experience.