
What Happens to Your Observability Scaling When Your Engineering Team Doubles?
Engineering teams that double in size rarely plan for what that means for their observability scaling needs.
The hiring plan gets approved. The onboarding process gets structured. The engineering capacity increases. And then, six to twelve months later, the observability costs have risen faster than expected, the alert volume has doubled, the on-call burden has spread to engineers who don’t fully know the systems they’re covering, and the mean time to resolution has crept upward as institutional knowledge about how the production system behaves is now distributed across twice as many people — many of whom weren’t there when the system was built.
This is the observability scaling problem. It is not exotic. It happens to almost every engineering team that grows quickly. And it is almost always addressed reactively — after the pain is already visible — rather than proactively, before the team doubles.
This post is about what happens to your observability stack as your site reliability engineering (SRE) team scales, why the pain compounds faster than most engineering leaders expect, and what needs to be in place to handle growth without a corresponding growth in incidents, investigation time, and on-call burden.
What Doubles When Your Team Doubles
The intuitive assumption is that when your engineering team doubles, your observability needs roughly double. More engineers, more services, more metrics — but the same tools, roughly twice as much data.
The reality is that several things grow faster than linearly when a team doubles, and the compounding effect is what produces the observability scaling pain.
Services grow faster than headcount
A team that doubles in size typically more than doubles its service count. Existing services get split for ownership clarity. New product areas get their own services. The microservices tendency that was already present accelerates because there are now enough engineers to own separate components. A team of 15 managing 30 services that grows to 30 engineers may find itself managing 80 services — not 60.
Each new service adds instrumentation requirements, alert rules, dashboard panels, and on-call coverage. The observability surface area grows faster than the team.
Knowledge concentration becomes knowledge dilution
In a small team, the engineers who built the production system are often the same engineers who monitor and respond to it. Root cause analysis is fast because the on-call engineer knows the system intimately — they know which metrics matter, which patterns are normal, which services are fragile.
When the team doubles, the new engineers don’t have this context. An on-call rotation that previously always included someone who knew the system deeply now regularly includes engineers who are still learning it. The investigation that took 20 minutes for an experienced engineer takes 90 minutes for someone who doesn’t yet know where to look.
This is the knowledge dilution problem. It does not fix itself with time — it requires a systematic approach to preserving and surfacing the institutional knowledge that experienced engineers carry implicitly.
Alert volume grows quadratically, not linearly
More services mean more alert rules. More alert rules on more services, with more engineers configuring thresholds, produces an alert volume that grows substantially faster than the team can triage it effectively. The alert fatigue that was manageable at 30 services becomes acute at 80.
As we covered in SRE Alert Fatigue 2026, the standard responses to alert fatigue — threshold tuning, routing improvements, runbook updates — address symptoms rather than causes. The cause is a reactive architecture that cannot distinguish signal from noise without human judgment applied to every alert.
On-call burden spreads but does not reduce
Adding engineers to the on-call rotation reduces each engineer’s frequency of duty but does not reduce the per-incident burden. If incident investigation takes 75 minutes for a new engineer who doesn’t know the system, adding ten engineers to the rotation does not reduce that 75 minutes — it distributes the burden but preserves its intensity.
The on-call experience for new engineers covering unfamiliar services is materially worse than for experienced engineers covering their own services. This is a retention risk as well as an operational one.
What Breaks First
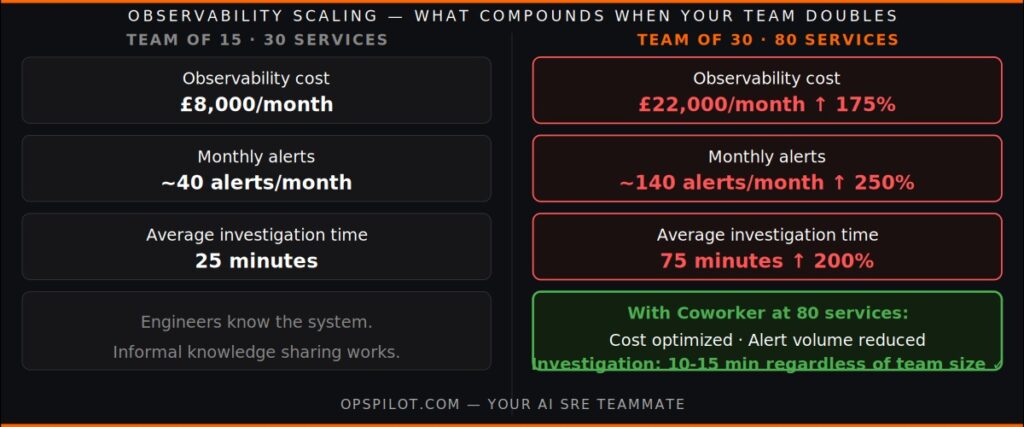
Based on the pattern of teams that have grown through this scaling challenge, three things break in a consistent order.
Observability costs exceed the budget model
The first visible consequence is usually cost. Observability platforms that price on data volume — metrics cardinality, log ingestion, trace storage — scale with service count and instrumentation density, not with engineering team size. A team that was comfortable at £8,000/month for 30 services may find itself at £22,000/month for 80 services with denser instrumentation — without a proportional increase in the operational value being extracted from the data.
As we covered in How To Defend Your Observability Budget in 2026, the question leadership asks is not “why does observability cost more?” but “what did we get for the increase?” If the answer is “more dashboards and more alerts but not fewer incidents,” the budget conversation becomes difficult.
Alert quality degrades before volume is addressed
The second consequence is alert quality degradation. As new services are added by engineers who configure thresholds without deep knowledge of the service’s normal behavior, alert rules are set too broadly. False positive rates increase. Engineers start ignoring alert channels that fire too frequently. The alerts that matter get lost in the noise from the alerts that don’t.
This is the point at which on-call becomes genuinely demoralizing — not because incidents are more frequent, but because most of the interruptions are noise, and distinguishing them from signal requires the same effort as a genuine incident.
Mean time to resolution increases as knowledge dilutes
The third consequence is MTTR creep. This is the hardest to see coming because it happens gradually. The median investigation time across all incidents rises as more incidents are handled by engineers who don’t deeply know the affected service. The p90 investigation time rises faster — the worst incidents, which are most likely to affect services that engineers are still learning, take significantly longer.
By the time MTTR creep is visible in incident review data, the problem has been compounding for months.
What Observability Scaling Actually Requires
The observability scaling problem is not solved by adding more dashboards or more alert rules. It is solved by changing the architecture from reactive to proactive, and by systematizing the institutional knowledge that a growing team cannot carry informally.
Proactive detection that doesn’t depend on who is on call
The knowledge dilution problem — new engineers spending 90 minutes investigating what experienced engineers resolve in 20 — is addressed not by training faster but by changing what the on-call engineer arrives at. If the investigation is already done before the engineer engages, the institutional knowledge gap becomes less consequential.
OpsPilot’s Coworker does the correlation and orientation work automatically when a situation surfaces or an alert fires. The engineer who doesn’t know the payments service deeply receives the same investigation context as the engineer who built it. As we explored in AI Incident Investigation, this is the observability scaling capability that changes the on-call experience for growing teams.
Continuous pattern detection that scales with service count
Threshold-based alerting requires someone to configure a threshold for every service and every metric worth monitoring. As service count grows, this configuration burden compounds — and the thresholds configured by engineers who don’t yet know the service well are the ones most likely to produce false positives or miss genuine issues.
Coworker’s continuous pattern detection works from your OpenTelemetry telemetry regardless of service count. Adding a new service to your OTLP pipeline brings it into Coworker’s analysis automatically — no new alert rules to configure, no new dashboard panels to maintain. The intelligence layer scales with your instrumentation, not with your engineering time.
Cost optimization that keeps pace with growth
Observability costs at scale are substantially reducible through systematic analysis of what your telemetry data actually contains. Over-instrumented services generating high-cardinality metrics that nobody queries. Log volumes that could be reduced without losing diagnostic value. Trace retention settings that were set conservatively during initial setup and never revisited.
Coworker surfaces these cost optimization opportunities as situations — specific recommendations, specific services, specific configurations — as part of its continuous analysis. Teams that have been running Coworker through a period of growth consistently report that the cloud and observability cost savings surfaced during that period meaningfully offset the platform cost.
For more on observability cost management at scale, see Telemetry Volume Goes Up Every Year and the metrics capability page.
Getting Ahead of the Scaling Problem
The best time to address the observability scaling problem is before the team doubles, not after the pain is visible. Three things are worth doing now if your team is growing.
Establish the intelligence layer before the knowledge dilution hits. Coworker builds baselines from your current system behavior. A team that starts running Coworker now, before the growth phase, arrives at the post-doubling period with mature baselines, established correction history, and a detection system that knows what normal looks like. A team that starts Coworker after the growth phase has to build those baselines on a system that has already changed substantially.
Audit your alert rules before adding more services. A growing service count added to an already-noisy alert configuration compounds the quality problem. Before the team grows, review which alert rules are producing genuine actionable alerts and which are generating noise. As we covered in SRE On-Call 2026, the alert quality problem is better solved proactively than retrospectively.
Price your observability stack for where you are going, not where you are. A platform that is affordable at 30 services may be prohibitively expensive at 80, particularly if it prices on data volume. Understanding the scaling curve of your current observability costs — and evaluating alternatives before renewal — is a more comfortable exercise when done from a position of stability rather than budget pressure. See the pricing page for OpsPilot’s tier comparison — no form, no sales call.
FAQ
Does adding OpsPilot require re-instrumenting our services as we add them?
No. New services added to your OTLP pipeline are automatically included in Coworker’s analysis. If a new service exports telemetry via OTLP, it joins the Coworker analysis pool without any additional configuration. Coworker will also identify coverage gaps for services that are not yet fully instrumented.
How does Coworker handle the knowledge dilution problem for new engineers?
Coworker provides the same investigation context regardless of which engineer picks up a situation or alert. A new engineer who has never worked on the payments service receives the same correlation work, dependency chain analysis, and specific recommended action that an experienced engineer would assemble manually. The institutional knowledge is systematized in the situation rather than residing in the engineer’s head.
At what team size does the observability scaling problem typically become acute?
The inflection point most commonly becomes visible when a team moves from 10-20 engineers to 30-50, or when service count crosses approximately 40-50 microservices. Below these thresholds, informal knowledge sharing and manual triage are still manageable. Above them, the compounding effects of alert volume, knowledge dilution, and MTTR creep typically become visible in incident data within two to three quarters.
Does OpsPilot’s pricing scale with team size or with services?
OpsPilot’s pricing is based on the services monitored and the telemetry volume analyzed, not on engineering team headcount. As your service count grows, you move through tiers — Starter at $49/month, Pro at $249/month, Advanced at $899/month. See /pricing/ for the full breakdown.
Growing team. Growing stack. Get the intelligence layer in place now.
Start your free trial → app.opspilot.com/sign-up
Or talk it through: Book a demo → calendly.com/fusionreactor-sales/opspilot-demo
OpsPilot is the AI SRE teammate for teams using OpenTelemetry, Prometheus, Grafana, and existing observability stacks — helping engineers investigate incidents, find root cause, and move toward autonomous operations without replacing their tools. OpsPilot, formerly FusionReactor Cloud, is Intergral’s AI-powered observability and AI SRE platform.