
Kubernetes Observability: What Changes When You Add AI SRE
Kubernetes observability is a solved problem at the data collection layer.
The OpenTelemetry Collector, deployed as a DaemonSet on your cluster nodes, can collect node-level metrics from the host, pod-level metrics from the kubelet, container-level metrics from cAdvisor, and application-level telemetry from your services via OTLP — all in a unified pipeline, all in a standard format, all exported to the backends of your choice. Add Prometheus for metrics storage, Grafana for visualization, Loki for logs, and Tempo for traces, and you have a mature, production-grade Kubernetes observability stack.
What this stack does not do is tell you what matters in the data it collects. It stores everything and surfaces what you query. It alerts when thresholds are crossed. It does not watch your cluster continuously and surface the patterns that precede the incidents your site reliability engineering (SRE) team is working to prevent.
This post is about what changes when you add an AI SRE intelligence layer to your Kubernetes observability stack — specifically, what Coworker does with your Kubernetes telemetry that your existing stack cannot do without human direction.
The Kubernetes Observability Data Problem
Kubernetes generates significantly more telemetry than equivalent non-containerized workloads. A cluster of 20 nodes running 200 pods generates node metrics, pod metrics, container metrics, application metrics, scheduler events, controller reconciliation events, network metrics, and storage metrics — continuously, for every component, at whatever scrape interval you’ve configured.
The volume is useful: the more complete the telemetry, the more complete the picture of what is happening in your cluster. It also creates an analytical challenge that human attention cannot address continuously. Nobody is watching all of this data all of the time. Engineers query specific metrics when investigating a known problem. Dashboards surface the metrics someone chose to visualize at the time the dashboard was built. Alert rules fire when specific thresholds are crossed.
The gap is everything that matters in between. The pod that is being OOM-killed at a rate that is increasing daily. The node that is running at 87% memory utilization and would benefit from workload redistribution. The HorizontalPodAutoscaler that is firing more frequently than it should because a traffic pattern has changed. The persistent volume that is 73% full and has been growing at 2GB per day. None of these may have crossed an alert threshold. All of them are visible in your Kubernetes telemetry. None of them will surface without someone looking for them specifically.
This is the Kubernetes observability data problem. The data collection layer is complete. The intelligence layer that watches the data continuously and surfaces what matters is not.
What Coworker Does With Your Kubernetes Telemetry
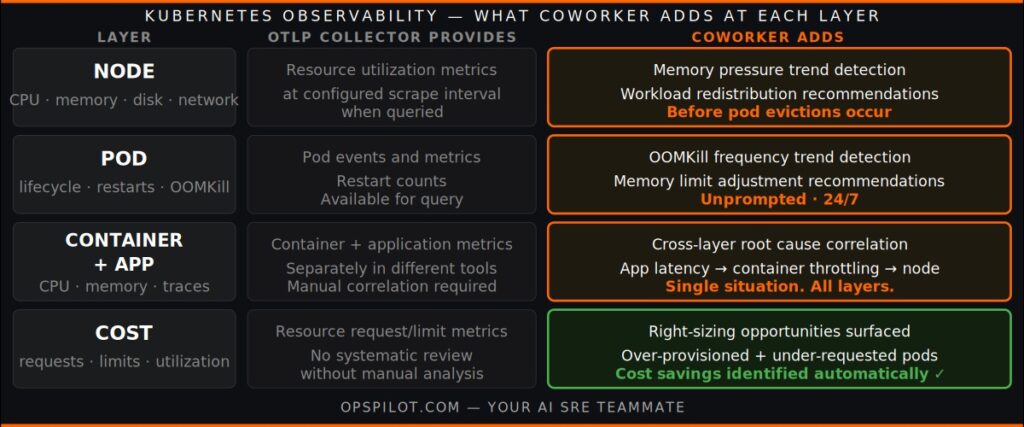
OpsPilot’s Coworker connects to your OTLP pipeline — the same telemetry stream your Prometheus and Grafana backends receive — and runs continuous analysis across your Kubernetes telemetry. The analysis covers four specific layers of the Kubernetes stack.
Node-level analysis
At the node layer, Coworker watches for resource pressure patterns that indicate impending node-level incidents. CPU throttling trends, memory utilization growth curves, disk I/O saturation, and network bandwidth pressure — all monitored continuously against baselines established from your cluster’s specific behavior.
A node that has been at 87% memory utilization for three days without triggering an alert is not a problem yet. A node at 87% memory utilization that has grown from 72% over the same three days, on a trajectory that reaches pressure at 92%, is a pattern worth surfacing. Coworker identifies the trend and raises a situation with a specific recommendation — whether workload redistribution, vertical scaling, or node addition — before the pressure causes pod evictions or node instability.
Pod-level analysis
At the pod layer, Coworker watches pod lifecycle patterns that indicate reliability issues before they surface as service degradation. Repeated restarts, OOMKill events, pending states, and crashloopbackoff patterns are the most visible, but Coworker also watches subtler signals: pods that are consistently slow to become ready, pods that show elevated resource consumption relative to their requests, pods that are being scheduled and rescheduled more frequently than their cluster peers.
The OOMKill analysis is particularly useful. A pod that is being OOM-killed once per week, at 2am, during a batch processing window may not have a threshold alert configured — the event is infrequent and the pod restarts automatically. But the pattern is visible in the kubelet metrics, and the trend — if OOMKill frequency is increasing — is a signal that the memory request is no longer appropriate for the workload. Coworker surfaces this with a specific recommended action: adjust the memory limit for the affected deployment.
Container and application correlation
At the container and application layer, Coworker correlates Kubernetes infrastructure signals with application telemetry from your services. When a service’s latency percentiles increase, Coworker investigates whether the cause is at the application layer (a slow query, a dependency degradation) or the infrastructure layer (CPU throttling on the container, resource contention at the node level).
This cross-layer correlation is the analysis that takes the most time when done manually. An engineer investigating a latency spike on the payment service needs to check the application metrics, then the container metrics, then the node metrics, then the Kubernetes events, then the related services — following the dependency chain across layers. Coworker does this correlation automatically and presents the findings as a single situation, regardless of which layer the root cause turns out to be at.
Cost and efficiency analysis
Kubernetes resource requests and limits set at initial deployment often drift from the actual resource consumption pattern of the workload over time. A service that requested 2 CPU cores at deployment and consistently uses 0.4 CPU cores is overprovisioned. A service that requested 512MB memory and regularly approaches 480MB is at risk of OOMKill.
Coworker’s continuous analysis of your pod resource metrics against configured requests and limits surfaces both categories — over-provisioned resources wasting cluster capacity and under-provisioned resources creating reliability risk. For teams running significant Kubernetes workloads, the cost optimization opportunities from right-sizing are typically substantial. See the monitoring Kubernetes capability page for how Coworker connects to Kubernetes-specific telemetry.
What Stays the Same
Adding Coworker to your Kubernetes observability stack does not replace any of your existing tooling. Your OpenTelemetry Collector deployment stays. Your Prometheus scrape jobs stay. Your Grafana dashboards and Kubernetes alert rules stay. Your existing on-call routing and PagerDuty configuration stays.
Coworker is an additional consumer of your OTLP telemetry stream — the same data that is flowing to your existing backends, flowing also to Coworker’s continuous analysis engine. One additional OTLP exporter in your Collector configuration. No new agents on your nodes. No changes to your existing instrumentation.
Your Kubernetes dashboards remain your dashboards. When your engineers want to investigate a specific signal or query a specific metric, they use Grafana exactly as before. What changes is that Coworker is watching everything in between — the patterns that develop between queries, the trends that form between incidents, the resource situations that accumulate without crossing a threshold — and surfacing what matters before you need to look.
As we covered in Grafana AI SRE, this is the intelligence layer above visualization that most Kubernetes observability stacks are missing. The data is there. The continuous analytical attention is what changes.
Getting Started With AI SRE on Your Kubernetes Cluster
The connection process for adding Coworker to an existing Kubernetes observability stack is straightforward.
If you are already running the OpenTelemetry Collector as a DaemonSet with OTLP export to your Prometheus and Grafana backends, adding Coworker is an additional exporter in your Collector configuration — pointing the same telemetry stream at OpsPilot’s OTLP endpoint. No redeployment of your Collector is required beyond the configuration change.
If you are running Prometheus with native scraping rather than OpenTelemetry, the OpenTelemetry Collector’s Prometheus receiver scrapes your existing endpoints and exports via OTLP — without changing your existing Prometheus setup.
First situations from Coworker typically arrive within the first 24-hour analysis cycle. For Kubernetes workloads, the initial situations often include resource optimization opportunities — over-provisioned deployments, under-requested containers, HPA configurations that could be tuned — alongside any active reliability patterns Coworker identifies in the first analysis pass.
The Prometheus AI SRE and OpenTelemetry Maturity posts cover the connection architecture in more detail. The monitoring Kubernetes page has the specific configuration for Kubernetes environments.
Ready to see what Coworker finds in your Kubernetes cluster? Start your free trial at app.opspilot.com/sign-up — no credit card required.
Frequently Asked Questions
Yes. Coworker connects to your OTLP telemetry stream regardless of whether your Kubernetes cluster is self-managed or a managed service. The OpenTelemetry Collector runs as a DaemonSet on your cluster nodes in all cases, collecting node, pod, container, and application metrics and exporting via OTLP. The managed Kubernetes provider does not affect how Coworker receives and analyzes the telemetry.
No. Coworker connects only to your OTLP endpoint — it receives the telemetry data your OpenTelemetry Collector exports, without direct access to the Kubernetes API or cluster credentials. The cluster access required to collect Kubernetes metrics is handled by the OpenTelemetry Collector on your infrastructure; Coworker receives the exported telemetry data only.
Coworker accounts for the dynamic nature of Kubernetes workloads in its baseline establishment. Deployment rollouts, autoscaling events, and pod lifecycle changes are incorporated into the analysis context rather than treated as anomalies. Coworker distinguishes between resource changes that are expected and resource changes that are anomalous — a pod restart pattern that does not correlate with any deployment or traffic change.
Coworker analyzes all metrics in your OTLP stream, including Kubernetes-specific metrics from the OpenTelemetry Collector's kubeletstats, k8s_cluster, and hostmetrics receivers. This includes node CPU, memory, disk, and network metrics; pod CPU, memory, and network metrics; container CPU, memory, and filesystem metrics; and Kubernetes object metrics. Application-level metrics from your services are analyzed alongside the infrastructure metrics to enable cross-layer correlation.
See what Coworker finds in your Kubernetes cluster. First situations in 24 hours.
Start your free trial → app.opspilot.com/sign-up
Or talk it through: Book a demo → calendly.com/fusionreactor-sales/opspilot-demo
OpsPilot is the AI SRE teammate for teams using OpenTelemetry, Prometheus, Grafana, and existing observability stacks — helping engineers investigate incidents, find root cause, and move toward autonomous operations without replacing their tools. OpsPilot, formerly FusionReactor Cloud, is Intergral’s AI-powered observability and AI SRE platform.