
Grafana AI SRE: How To Add Intelligence to Your Existing Grafana Stack
Grafana is excellent at what it was built to do — and for teams exploring Grafana AI SRE, that distinction matters.
It visualizes your telemetry beautifully. Its dashboards are configurable, its alerting is flexible, and its support for OpenTelemetry, Prometheus, Loki, and Tempo makes it the natural visualization layer for most modern observability stacks. For teams that have invested in Grafana — the dashboards, the alert rules, the panel configurations — it works.
The question that Grafana AI SRE addresses — and what this guide covers — is not whether Grafana works. It is what Grafana cannot do — and whether adding an AI site reliability engineering (AI SRE) intelligence layer on top of your existing Grafana setup gives your team something genuinely different.
The answer is yes. And the reason is architectural: Grafana is a pull-based visualization system. It shows you what is in your data when you look at it. Grafana AI SRE adds the continuous analytical layer that watches your data when you are not looking — and surfaces what matters before you need to open a dashboard to find it.
This post is a practical guide to what Grafana AI SRE looks like, how it connects to your existing stack, and what changes for your team when you add it.
What Grafana Does Well — And Where It Stops
Understanding where Grafana’s capability ends is the starting point for understanding what Grafana AI SRE adds.
Grafana stores nothing and collects nothing. It queries your backends — Prometheus for metrics, Loki for logs, Tempo for traces — and renders the results. Its value is in making your telemetry queryable and visible. It is an excellent tool for the question “what is happening right now?” and a reasonable tool for the question “what happened between Tuesday and Thursday?” It is not designed to answer “what should I pay attention to next?”
Alert rules in Grafana help — they fire when metrics cross configured thresholds. But threshold-based alerting is reactive. It tells you a condition has been met after it has already developed. It does not tell you a condition is developing before you need to act.
This is the gap that Grafana AI SRE closes. As we covered in What Is An Observability Platform?, most teams running Grafana have Layers 1 and 2 of the observability platform model — collection and visualization. What they are missing is Layer 3: the intelligence layer that continuously analyzes what the data contains and surfaces what matters without being asked. See also Your Observability Stack Is Missing Layer 3.
How Grafana AI SRE Works in Practice
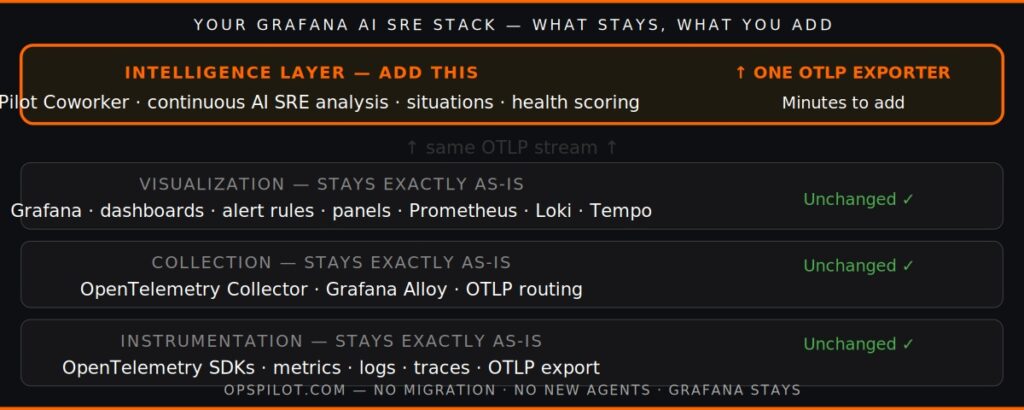
Adding Grafana AI SRE with OpsPilot does not require changing your Grafana setup. Your dashboards stay. Your alert rules stay. Your Prometheus queries, your Loki log panels, your Tempo trace views — all unchanged.
What you add is a second destination for your OTLP telemetry. Your OpenTelemetry Collector or Grafana Alloy is already routing your telemetry to your Prometheus, Loki, and Tempo backends. You add OpsPilot as an additional OTLP exporter. The same telemetry stream flows to both — your existing Grafana stack receives it as before, and OpsPilot’s Coworker begins continuous analysis.
The full Grafana AI SRE stack looks like this:
Your instrumentation layer (unchanged): OpenTelemetry SDKs in your services, exporting metrics, logs, and traces via OTLP.
Your collection layer (unchanged): OpenTelemetry Collector or Grafana Alloy, receiving OTLP data and routing it.
Your visualization layer (unchanged): Grafana, querying Prometheus, Loki, and Tempo. Your dashboards. Your alerts. Exactly as they are.
The intelligence layer (what you add): OpsPilot’s Coworker, receiving the same OTLP stream and running continuous AI SRE analysis. Pattern detection, situation surfacing, health scoring, gap detection — delivered to Slack or Microsoft Teams.
The configuration is a single OTLP exporter pointing at OpsPilot. The setup takes minutes. The first situations typically surface within the first 24-hour analysis cycle.
Already running Grafana? See what Coworker finds in your data. Start your free trial at app.opspilot.com/sign-up — no credit card required.
What Changes When You Add Grafana AI SRE
The practical difference for a team running Grafana with OpsPilot’s Coworker is not in the dashboards — those are unchanged. It is in how the team relates to their production system between incidents.
Before Grafana AI SRE: Your dashboards are there when you check them. Your alerts fire when thresholds are crossed. Between checks and between alerts, your production system is generating telemetry that nobody is continuously analyzing. The patterns that will become the next incident are developing in your Prometheus metrics and Loki logs, visible to anyone who queries them — but nobody is querying.
After Grafana AI SRE: Coworker is watching continuously. When it identifies the connection pool trending toward saturation, or memory growth on a trajectory that ends in OOM restart, or a slow query pattern emerging under increasing load, it writes an insight and groups it into a situation. The situation arrives in your team’s Slack channel during business hours — specific service, specific pattern, specific recommended action, estimated effort.
Your engineer resolves it in 15 minutes. Your Grafana dashboard, if you open it afterwards, confirms what Coworker found. The 2am page never fires.
This is what the proactive AI capability at the intelligence layer actually produces. Not a replacement for Grafana. A complement to it that handles the continuous watching that Grafana was never designed to do.
Grafana AI SRE and Your Existing Alert Rules
A common question when adding Grafana AI SRE is whether to keep existing Grafana alert rules.
The answer is yes — keep them. Coworker operates upstream of your alerting layer, not as a replacement for it. When Coworker identifies a pattern early and your team resolves it proactively, the Grafana alert that would have fired doesn’t fire. When a genuinely novel failure occurs that Coworker hasn’t seen before, your Grafana alerts catch it as before — and Coworker provides investigation context the moment the alert fires, doing the correlation work before your engineer opens a dashboard.
The on-call experience shifts in a specific way: fewer pages from Grafana, and when pages do come, the situation context is already assembled. The investigation phase shrinks from 60-90 minutes to 10-15 minutes because Coworker has already followed the dependency chain and identified the probable cause.
As we covered in OpenTelemetry Is Now The Standard, the intelligence layer sits above both your collection stack and your visualization stack — it does not replace either. Grafana remains your visualization layer. Coworker is the analytical layer that watches your stack while Grafana waits to be queried.
What Grafana AI SRE Finds That Dashboards Miss
The specific categories of situations that Coworker surfaces on a typical Grafana AI SRE stack:
Performance patterns before threshold. Connection pool saturation trending upward. Memory allocation on a growth curve. Latency percentiles creeping up under load. These are visible in Prometheus metrics — but only if someone queries the right metric at the right time. Coworker watches them continuously and surfaces the pattern before the Grafana alert fires.
Cost optimization from utilization data. Your Prometheus metrics include resource utilization data that contains cost signal — over-provisioned resources, idle allocations, inefficient configurations. Coworker surfaces these as situations with specific estimated savings. Most teams running Grafana have this data but no systematic process for identifying waste within it.
Instrumentation gaps. Grafana can only visualize what reaches it. Coworker identifies which services in your topology lack complete trace propagation, which database calls aren’t instrumented, which external dependencies create analytical blind spots. These gaps are invisible in Grafana — you can’t see what isn’t there. Coworker surfaces them as coverage situations so you can prioritize where to improve.
Cross-signal correlation. OpenTelemetry’s trace context links metrics, logs, and traces from the same request across service boundaries. When an incident occurs, Coworker follows this context automatically — correlating the Loki log entries, the Prometheus metrics, and the Tempo traces to identify which service in the dependency chain is the root cause. This is the investigation work that takes your engineers 60-90 minutes manually. Coworker does it before they open a dashboard.
For more on the specific AI SRE tools available for Grafana users, see the best AI SRE tools for Grafana guide and the OpenTelemetry capability page.
FAQ
Does adding OpsPilot require migrating away from Grafana? No. Grafana stays exactly as it is. OpsPilot connects to your OTLP pipeline alongside your existing Grafana backends — it does not replace Grafana, Prometheus, Loki, or Tempo. Your dashboards, alert rules, and panel configurations are unchanged.
Does it work with Grafana Cloud or only self-hosted Grafana? Both. OpsPilot connects to your OTLP endpoint regardless of whether your Grafana backends are self-hosted or cloud-based. The configuration is on the OTLP exporter side — OpsPilot receives the same telemetry stream that your Grafana stack receives.
What happens to my existing Grafana alerts when Coworker starts? They continue to work exactly as before. Coworker operates upstream of your alerting layer — when it catches a pattern early and your team resolves it proactively, the Grafana alert that would have fired doesn’t fire. When alerts fire, Coworker provides investigative context immediately, performing correlation before your engineer opens a dashboard.
How long before Grafana AI SRE starts surfacing useful situations? The first situations typically arise within the first 24-hour analysis cycle — usually a mix of cost-optimization opportunities and performance patterns. Accurate baseline establishment, which sharpens pattern detection precision, takes approximately one week as Coworker learns your specific traffic patterns and service behavior.
Already running Grafana? Add the intelligence layer in minutes.
OpsPilot is the AI SRE teammate for teams using OpenTelemetry, Prometheus, Grafana, and existing observability stacks — helping engineers investigate incidents, find root cause, and move toward autonomous operations without replacing their tools. OpsPilot, formerly FusionReactor Cloud, is Intergral’s AI-powered observability and AI SRE platform.