
OpenTelemetry Is Now The Standard. The Next Question Is What You Do With All That Data.
OpenTelemetry has won.
That is not a prediction. It is a description of the current state of production observability tooling. The CNCF graduated OpenTelemetry in 2021. Every major cloud vendor now supports OTLP natively. Every major observability backend accepts OpenTelemetry data. The major APM vendors — Datadog, Dynatrace, New Relic — have all built OTLP ingestion. The instrumentation debate is largely settled.
For most engineering teams running modern production systems in 2026, OpenTelemetry is either already in place or actively being adopted. The question of how to instrument services, collect metrics, logs, and traces, and transport them via OTLP to a backend is well understood and well served by tooling.
This is genuinely good news. It represents years of community work producing a standard that has made the observability ecosystem more interoperable, more portable, and less vendor-dependent than it has ever been.
But it surfaces a different question — one that is less well served by the current tooling conversation.
You have the data. Now what do you do with it?
The Gap OpenTelemetry Doesn’t Close
OpenTelemetry is an instrumentation and transport standard. It defines how to collect telemetry data from your services and how to send it somewhere. It does not define what to do with it once it arrives.
This is an intentional design choice, not an oversight. OpenTelemetry is a data standard, not an analysis platform. Its scope ends at the point where data reaches a backend — what happens next is the responsibility of whatever receives that data.
For most teams, what receives the data is a combination of storage backends (Prometheus, Loki, Tempo, or vendor equivalents) and visualization tools (Grafana, or a unified platform like Datadog). These are excellent at making data visible and queryable. They are not designed to analyze it continuously, identify what matters, and surface actionable conclusions without being asked.
The gap OpenTelemetry doesn’t close is the gap between having data and knowing what to do with it. Between visibility and action. Between a system that tells you what happened and one that tells you what to fix.
As we covered in OpenTelemetry Without Intelligence Is Just Expensive Data Collection, the instrumentation investment is only fully realized when data is actively analyzed. Without that layer, teams are collecting more telemetry than they ever have — and doing manual investigation work to extract value from it that could be substantially automated.
What AI SRE Adds to Your OpenTelemetry Stack
The layer that closes the gap is AI site reliability engineering (AI SRE) — specifically, a continuous intelligence layer that connects to your existing OTLP pipeline and analyzes the data your OpenTelemetry instrumentation is already producing.
OpsPilot’s Coworker does not replace your OpenTelemetry instrumentation. It does not replace your Grafana dashboards or your Prometheus metrics backend. It connects to your existing OTLP endpoint — the same one your telemetry is already flowing through — and adds the analytical layer that OpenTelemetry was never designed to provide.
What that looks like in practice:
Pattern detection from OTLP data. Coworker reads your metrics, logs, and traces via OTLP and continuously matches them against known failure patterns. Connection pool trends. Memory growth curves. Slow query progression. Upstream dependency latency degradation. These patterns are in your OpenTelemetry data right now. Coworker finds them before they cross an alert threshold — before the 2am page.
Cross-signal correlation. One of the most powerful aspects of OpenTelemetry is that it produces correlated telemetry — trace context propagated across service boundaries, metrics and logs tied to the same instrumented services. Coworker uses this correlation to connect signals across your stack when an incident occurs, identifying which service in the dependency chain is the root cause rather than requiring manual trace-by-trace investigation. As we covered in You Have 10,000 Metrics. Why Does Root Cause Still Take 3 Hours?, this investigation work is where most incident time is lost.
Instrumentation gap detection. OpenTelemetry instrumentation is rarely complete on day one — or day one hundred. Services get added. Context propagation breaks at service boundaries. Database calls don’t propagate trace IDs. External API calls create blind spots. Coworker continuously evaluates your instrumentation coverage and surfaces the gaps before an incident exposes them, as described in What Is An Observability Platform?
Cost optimization from utilization data. Your OpenTelemetry metrics include resource utilization data — CPU, memory, connection pools, database query patterns. Coworker scans this data continuously for waste: over-provisioned resources, idle allocations, redundant instrumentation generating cost without analytical value. The cost optimization findings typically surface within the first analysis cycle and frequently offset the cost of the intelligence layer itself.
Already running OpenTelemetry? See what Coworker finds in your data. Start your free trial at app.opspilot.com/sign-up — no credit card required.
The OpenTelemetry + AI SRE Stack
For a team already running OpenTelemetry, the path to AI SRE is the shortest it has ever been. The instrumentation is in place. The data is flowing. The question is where to add the intelligence layer.
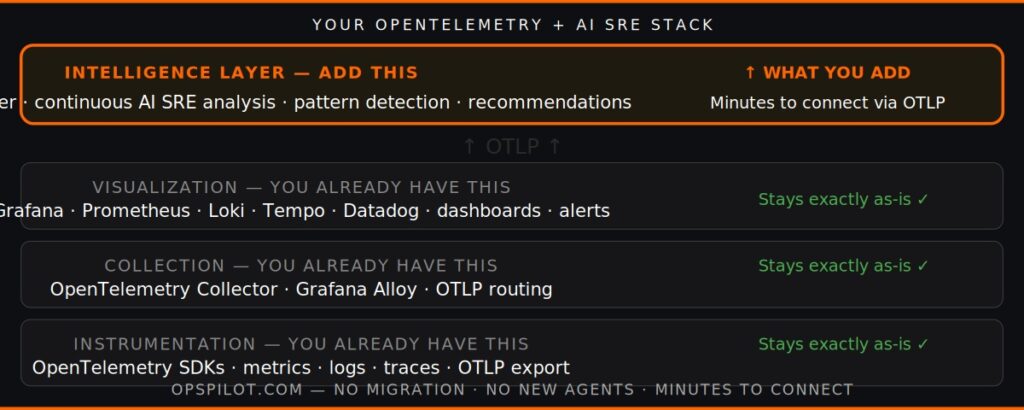
The stack that most teams arrive at looks like this:
Instrumentation layer: OpenTelemetry SDKs in your services, exporting via OTLP. This is what you already have.
Collection and transport: OpenTelemetry Collector or Grafana Alloy, receiving OTLP data and routing it to backends. This is also what you already have.
Storage and visualization: Prometheus for metrics, Loki for logs, Tempo for traces — or a unified backend like Grafana Cloud. Your dashboards. Your alerts. This stays exactly as it is.
Intelligence layer: Coworker, connecting to your OTLP pipeline and running continuous analysis. This is what you add. No changes to instrumentation. No changes to your visualization setup. No data migration.
The only configuration required is pointing an OTLP exporter at OpsPilot alongside your existing backend — a configuration that takes minutes, not hours.
For more on how this fits into the full observability platform picture, see our OpenTelemetry capability page and the best AI SRE tools for OpenTelemetry guide.
Why OpenTelemetry Makes AI SRE Better
The relationship between OpenTelemetry and AI SRE is not just additive — OpenTelemetry data specifically is better suited to AI SRE analysis than proprietary agent data.
Correlated signals. OpenTelemetry’s trace context propagation means that metrics, logs, and traces from a single request are linked by trace ID across service boundaries. This correlation is exactly what AI SRE needs to do effective root cause analysis — the ability to follow a single request from the user-facing service through every downstream dependency and identify precisely where it degraded.
Consistent schema. OpenTelemetry’s semantic conventions define consistent attribute naming across services and languages. This consistency allows pattern matching to work reliably across a mixed-language, mixed-framework production system — the same attribute names meaning the same things regardless of which SDK generated the data.
Vendor neutrality. OpenTelemetry data is not locked to a single backend or analysis tool. Adding Coworker to your OTLP pipeline does not create new vendor dependencies. If you decide to change your visualization backend, your AI SRE layer is unaffected. This is the architectural composability that makes OpenTelemetry-native AI SRE sustainable as a long-term choice.
Coverage visibility. OpenTelemetry’s resource attributes and service naming conventions make instrumentation coverage auditable. Coworker can identify which services are instrumented, which are not, and which have incomplete coverage — because OpenTelemetry defines what complete coverage looks like.
The Question Behind the Question
The original question — what do you do with all that OpenTelemetry data — has a more specific form that reveals the real opportunity.
You have 10 million production incidents worth of pattern data flowing through your OTLP pipeline right now, in the form of the metrics, logs, and traces your instrumented services are generating. Those signals contain the early warning of every failure that follows a recognizable pattern — and as we documented in The 7 Patterns Behind 95% of Production Failures, 95% of failures follow recognizable patterns.
The question is not really “what do you do with the data?” The question is: “is anything watching it continuously enough to find the patterns before they become incidents?”
For most teams running OpenTelemetry without an AI SRE intelligence layer, the answer is no. The data is there. The patterns are there. Nobody — and nothing — is watching systematically.
That is the gap Coworker closes. Not by replacing OpenTelemetry, not by replacing Grafana or Prometheus, but by doing what neither was designed to do: watching continuously, matching patterns, and delivering conclusions to your team before the pager goes off.
You’ve done the hard work of instrumenting your services with OpenTelemetry. The intelligence layer is the part that makes that work pay off at its full potential.
FAQ
Does OpsPilot require us to change our OpenTelemetry instrumentation? No. Coworker connects to your existing OTLP endpoint. Your current instrumentation, your current SDKs, your current semantic conventions — all unchanged. You add an OTLP exporter pointing to OpsPilot alongside your existing backend. That is the full extent of the setup.
Does it work alongside Grafana and Prometheus? Yes. Coworker receives the same OTLP data your Grafana/Prometheus stack receives. Your dashboards, alerts, and queries continue to work exactly as before. Coworker adds the analytical layer above your visualization stack — it does not replace it. See What Is An Observability Platform? for the full Layer 1/2/3 breakdown.
How quickly does it start finding patterns in our OpenTelemetry data? The first analysis cycle runs within 24 hours of connection. Initial recommendations typically arrive in that first cycle. Baseline establishment — which improves the precision of pattern detection — takes approximately one week as Coworker learns your specific traffic patterns and normal behavior.
What if our OpenTelemetry coverage is incomplete? Incomplete coverage is the norm, not the exception. Coworker’s gap detection capability surfaces which services and trace paths have incomplete instrumentation as part of its continuous analysis. You don’t need complete coverage to start getting value — and Coworker helps you prioritize where to improve coverage for the most analytical impact.
Already running OpenTelemetry? Add the intelligence layer in minutes.
OpsPilot is the AI SRE teammate for teams using OpenTelemetry, Prometheus, Grafana, and existing observability stacks — helping engineers investigate incidents, find root cause, and move toward autonomous operations without replacing their tools. OpsPilot, formerly FusionReactor Cloud, is Intergral’s AI-powered observability and AI SRE platform.