
SLO Monitoring: Why Most Teams Get It Wrong — And What AI SRE Changes
Most engineering teams that have implemented service level objectives — and SLO monitoring — are monitoring them wrong.
This is not a criticism of the teams — it is a description of the most common implementation pattern. Teams define an SLO, configure an alert that fires when the SLO is breached, and consider SLO monitoring implemented. This approach is technically correct and operationally insufficient. An alert that fires when your SLO is breached tells you the thing you should have prevented has already happened. It does not give you any opportunity to prevent it.
The SLO monitoring problem is the same architectural problem that appears throughout modern site reliability engineering (SRE): reactive detection that fires after a condition has been met rather than proactive detection that identifies the trajectory toward the condition while there is still time to act.
This post covers why threshold-based SLO monitoring is insufficient, what burn rate monitoring adds, and what changes when an AI SRE intelligence layer is watching your error budget trajectory continuously rather than waiting for you to query it.
Why Threshold-Based SLO Monitoring Falls Short
The most common SLO monitoring implementation works like this: define a reliability target — 99.9% availability over a 30-day rolling window — configure an alert that fires when availability drops below 99.9%, and route that alert to the on-call engineer.
This is better than no SLO at all. It is not useful SLO monitoring.
The problem is that a 99.9% SLO over 30 days gives you an error budget of approximately 43 minutes per month. An alert that fires when you breach 99.9% fires after you have consumed your entire error budget. The alert is not warning you of a problem — it is informing you that the problem has already consumed all the time you had to prevent it.
By the time the threshold-based SLO alert fires, three things have already happened. Your users have experienced more than 43 minutes of degradation. Your SLO is breached for the measurement period. And the incident that caused the breach has been developing — visibly, in your telemetry data — for some time before it crossed the threshold.
This is the core SLO monitoring failure: defining a target and then only alerting when the target has been missed, rather than monitoring the trajectory toward the target and alerting when the trajectory becomes dangerous.
What Burn Rate Monitoring Adds
The SLO monitoring improvement that the SRE community developed to address this is burn rate alerting — monitoring how quickly you are consuming your error budget rather than whether you have consumed all of it.
A burn rate of 1x means you are consuming your error budget at exactly the rate that would exhaust it at the end of the measurement window. A burn rate of 2x means you are consuming it twice as fast, which would exhaust your budget in half the time. A burn rate of 14.4x on a 30-day SLO with a 43-minute budget means you would exhaust your error budget in 5 minutes at the current rate — a genuine emergency that warrants immediate response.
Multi-window burn rate alerting — alerting when burn rate exceeds a threshold across both a short window (1 hour) and a longer window (6 hours) — reduces false positives while maintaining sensitivity to genuine degradation. This is the Google SRE approach to SLO monitoring and represents a meaningful improvement over threshold-based alerting.
But burn rate monitoring, as typically implemented, is still reactive. You configure the burn rate thresholds. You configure the window sizes. You configure the alert routing. The monitoring system evaluates whether those conditions have been met. It does not watch your error budget trajectory unprompted, identify the patterns in your telemetry that are driving budget consumption, or surface a conclusion about what is causing the burn rate before you investigate manually.
What AI SRE Changes About SLO Monitoring
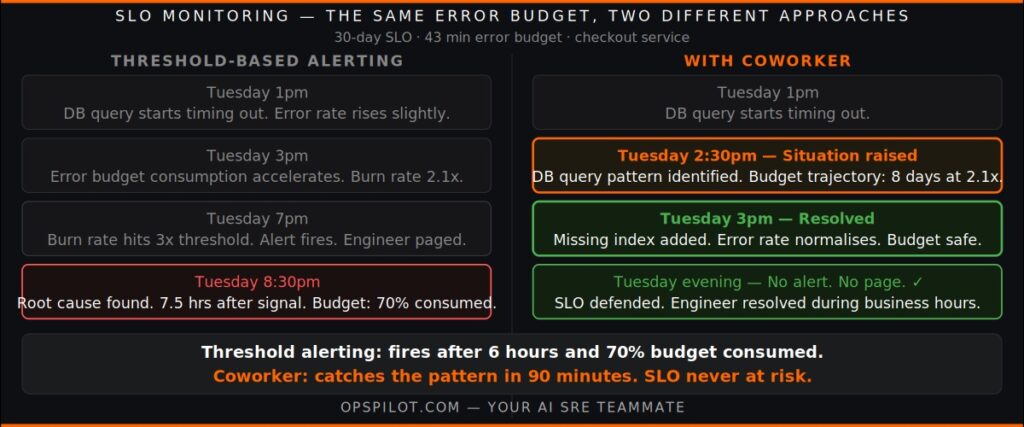
The shift that AI SRE makes to SLO monitoring is the same shift it makes to incident detection more broadly: from threshold evaluation to pattern detection, and from reactive alerting to proactive situation surfacing.
OpsPilot’s Coworker watches your error budget trajectory continuously. When it identifies a pattern in your telemetry that is driving error budget consumption — a latency degradation on a specific endpoint, an elevated error rate on a downstream dependency, a configuration change that has introduced a reliability regression — it surfaces a situation before the burn rate crosses a configured alert threshold.
The practical difference is significant. Where burn rate alerting fires when the burn rate has already reached a dangerous level, Coworker’s pattern detection catches the contributing factor while the burn rate is still recoverable. Where burn rate alerting fires during the incident, Coworker surfaces the pattern that is causing the incident — often hours earlier.
This is the architecture described in From Firefighting to Prevention: catching the failure precursor rather than responding to the failure. In the SLO monitoring context, the failure precursor is the pattern driving error budget consumption, and catching it early means the SLO is defended rather than breached.
What Coworker’s SLO monitoring situation looks like
A specific example. Your availability SLO for the checkout service is 99.9% over 30 days. Your current error budget is at 65% consumed with 12 days remaining — within acceptable parameters but tighter than normal for this point in the month.
At 3pm on a Tuesday, Coworker’s continuous analysis identifies that the checkout service’s error rate has been elevated for 90 minutes, driven by a specific database query that is timing out intermittently. The error rate is not yet high enough to trigger your burn rate alert — the burn rate is at 2.1x, below your configured alert threshold of 3x. But at 2.1x with 65% of your budget already consumed and 12 days remaining, the projection is that you will exhaust your error budget in 8 days rather than 12.
Coworker raises a situation: checkout service error budget at accelerated consumption rate. Contributing factor: database query timeout on order-service payment lookup, intermittent for 90 minutes. Projected budget exhaustion: 8 days at current rate. Recommended action: investigate query plan degradation on payment_orders table, review recent schema changes.
Your engineer reviews the situation during business hours, identifies a missing index introduced in a recent deployment, adds the index, and the error rate normalises. The error budget consumption returns to a safe trajectory. Your SLO is defended. No burn rate alert fires. No on-call page is required.
This is SLO monitoring done right — not a faster alert when the SLO is breached, but pattern detection that prevents the breach.
Ready to see how Coworker monitors your error budgets? Start your free trial at app.opspilot.com/sign-up — no credit card required.
The Three SLO Monitoring Improvements AI SRE Provides
Beyond the specific example above, AI SRE improves SLO monitoring in three systematic ways.
Contributing factor identification before burn rate alerting
Burn rate alerts tell you that your SLO is at risk. They do not tell you why. The investigation — identifying which service, endpoint, dependency, or recent change is driving the elevated error rate or latency degradation — still requires manual analysis after the alert fires.
Coworker’s situation output includes the contributing factor analysis: which specific component is driving error budget consumption, what the pattern looks like in the telemetry data, and what the recommended action is. The engineer arrives at a conclusion rather than a blank slate. As we covered in AI Incident Investigation, this investigation pre-work is where the majority of MTTR is consumed.
Early warning from correlated signals
Your SLO measures a user-facing reliability outcome. The contributing factors are often several steps removed — a database index degradation, a dependency latency increase, a memory growth pattern in a downstream service. The connection between the user-facing signal and the contributing factor is not always visible in the burn rate metric itself.
Coworker correlates across your full OpenTelemetry telemetry — metrics, logs, and traces — to identify the upstream contributing factors to error budget consumption. A 0.3% error rate increase on the checkout service that would take six hours to register as a burn rate alert may be attributable to a specific database query that started showing elevated execution times two hours ago. Catching the database signal early, before it has driven meaningful error budget consumption, is the SLO monitoring improvement that prevents breaches rather than responding to them.
SLO coverage gap identification
Many teams have SLOs for their most critical user-facing services and incomplete or no SLOs for the supporting services that affect them. A payment processing SLO is only as meaningful as the reliability of the database, the authentication service, and the third-party payment processor that the payment flow depends on.
Coworker’s continuous analysis identifies gaps in SLO coverage — services that appear frequently in incident correlation but have no defined SLOs, or services where the error budget consumption is being driven by a dependency that is not independently monitored. As we covered in OpenTelemetry Maturity, this coverage gap identification is part of the broader instrumentation quality assessment that Coworker surfaces as situations.
For more on how OpsPilot connects to your existing observability stack for SLO monitoring, see the metrics capability page and the intelligent alerting page.
Getting SLO Monitoring Right
If you currently have SLOs but only threshold-based alerting, the immediate improvement is implementing burn rate monitoring — multi-window burn rate alerts that fire at 2% and 5% budget consumed in the short and long windows. This is well-documented in the Google SRE Workbook and represents a meaningful improvement over threshold alerting.
The next improvement is adding the intelligence layer that watches your error budget trajectory and contributing factors continuously, without waiting for a burn rate threshold to be crossed. This is what OpsPilot’s Coworker provides — not a replacement for your burn rate alerts, but a proactive layer above them that catches the patterns driving error budget consumption before the alerts fire.
For teams that don’t yet have formal SLOs, the observation is that SLO monitoring with AI SRE is more immediately useful than without it. The friction of defining SLOs — choosing the right targets, configuring alerts, calibrating thresholds — is reduced when Coworker can surface the reliability patterns it observes from your telemetry data and suggest where SLOs would be most valuable.
Frequently Asked Questions
No. Coworker analyzes your telemetry continuously regardless of whether you have formal SLOs configured. For teams without SLOs, Coworker's health scoring provides a composite view of reliability quality across multiple dimensions. For teams with SLOs, Coworker's analysis adds proactive error budget trajectory monitoring. SLO configuration is not a prerequisite for getting value from Coworker.
Grafana's SLO feature tracks error budget consumption and surfaces burn rate metrics for visualization and alerting. Coworker's SLO monitoring adds the analytical layer: identifying the contributing factors to error budget consumption, correlating across service boundaries to find upstream causes, and surfacing situations with specific recommended actions before burn rate thresholds are crossed. The two complement each other — Grafana for visualization and threshold alerting, Coworker for proactive pattern detection and contributing factor analysis.
Effective SLO monitoring requires metrics — particularly request rates, error rates, and latency percentiles — and ideally distributed traces to follow requests across service boundaries and identify which downstream services are contributing to SLO degradation. Logs add context for contributing factor identification. The richer the OpenTelemetry instrumentation, the more precise the SLO monitoring analysis.
Coworker's continuous analysis of your telemetry data builds baselines for your services' actual reliability performance over time. These baselines are useful input for SLO target setting — understanding what your services actually deliver rather than aspirational targets disconnected from operational reality. Coworker does not directly recommend SLO targets, but the health scoring and pattern data it surfaces is informative for the target-setting conversation.
Catch error budget burn before it becomes a breach.
Start your free trial → app.opspilot.com/sign-up
Or talk it through: Book a demo → calendly.com/fusionreactor-sales/opspilot-demo
OpsPilot is the AI SRE teammate for teams using OpenTelemetry, Prometheus, Grafana, and existing observability stacks — helping engineers investigate incidents, find root cause, and move toward autonomous operations without replacing their tools. OpsPilot, formerly FusionReactor Cloud, is Intergral’s AI-powered observability and AI SRE platform.