
Log Management in 2026: Why Your Observability Platform Has a Volume Problem
Log volume goes up every year. Query patterns stay roughly the same. The gap between what teams collect and what they actually use has been widening for years — and most observability platform log management strategies do nothing to close it.
The default log management approach is: collect everything, retain it uniformly, and query it when an incident occurs. This approach made more sense when log volume was manageable and storage was expensive enough to force selectivity. In 2026, storage is cheap, OpenTelemetry has made unified log collection trivially easy, and the result is observability platforms drowning in log data that will never be queried.
The volume problem in log management is not just a cost problem — though as we covered in Observability Cost, 15-25% of log ingestion cost is typically below diagnostic value and can be reduced without any loss of operational capability. The more significant problem is that high log volume actively undermines the insight log data should provide. When everything is logged, nothing stands out. The signal that matters is buried in the noise of everything that doesn’t.
This post is about what mature log management looks like on a modern site reliability engineering (SRE) observability platform — not more volume, better signal — and what AI SRE adds to the picture.
How Log Management Became a Volume Problem
The evolution of log management over the past decade followed a predictable pattern. As applications moved from monoliths to microservices, log volume multiplied. Each service boundary added log output. Container orchestration added infrastructure logs alongside application logs. Distributed tracing added correlation log entries. OpenTelemetry standardized collection and made it easier to route logs to central storage alongside metrics and traces.
Each step was operationally correct. Unified log collection from all services through a standard pipeline is genuinely better than fragmented tool-specific log collection. The problem was that as collection became easier, selectivity decreased. If collection is trivial, why not collect everything?
The answer is: because everything includes a lot of DEBUG and INFO entries that describe normal operation in detail that is never operationally useful. For a high-traffic service handling thousands of requests per minute, DEBUG logging produces log volume that is orders of magnitude larger than WARN and ERROR output — and that is consumed almost entirely by storage, not by investigation.
The practical consequence: when an incident occurs and an engineer opens their log management tool to investigate, they are searching through a volume that is mostly irrelevant. The signal-to-noise ratio is low. Finding the relevant log entry requires either knowing exactly what to search for, or running broad queries and filtering manually — which takes time and cognitive effort that shows up in MTTR.
As we covered in Telemetry Volume, the trajectory without intervention is one-directional. Volume grows as services grow. Without active management, the log management problem compounds.
What Good Log Management Looks Like on a Modern Observability Platform
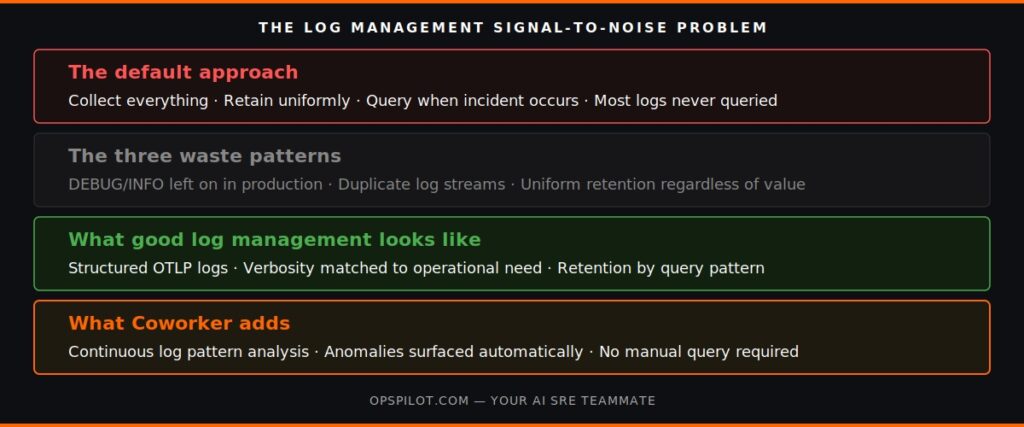
Good log management in 2026 is not about storing less. It is about surfacing what matters automatically — and reducing the engineering time spent manually separating signal from noise.
Structured logs with meaningful fields
Unstructured log lines — freeform text strings with timestamps — are the lowest-value log format from an observability platform perspective. They can be searched with regex, but they cannot be aggregated, correlated, or automatically analyzed without significant engineering effort.
Structured logs — JSON-formatted with consistent field schemas, correlated with trace IDs and service identifiers — are the prerequisite for everything else that matters in modern log management. OpenTelemetry’s log data model provides this structure natively. Teams that have adopted OTLP for metrics and traces and have not yet moved to structured log collection have the single most valuable log management improvement available to them.
Verbosity configuration that matches operational need
The default log level for most services in production is set once during development and rarely revisited. DEBUG logging that was useful for local development adds cost and noise in production at significant scale. A production service running at WARN level for routine operation, with contextual DEBUG output triggered only during active incidents or investigation sessions, produces log volume that is substantially smaller and meaningfully more useful per entry.
Most teams know this. Few have systematically audited their production log verbosity configurations against actual query patterns. The audit consistently finds services running at DEBUG or INFO levels where WARN is operationally sufficient — producing cost and noise that nobody has had time to address.
Retention calibrated to query patterns
Uniform retention — 90 days for all logs from all services at all severity levels — is the log management equivalent of leaving the lights on everywhere in case someone might need them. Most incident investigation uses logs from within 48 hours of the incident window. Forensic investigation occasionally requires older data. Compliance requirements vary by data type.
A retention strategy that matches retention period to actual query patterns — shorter for high-volume routine operation logs, longer for audit-relevant and security logs — reduces cost and improves query performance without reducing operational capability.
AI-surfaced log patterns
The most significant change in log management on a modern AI SRE observability platform is that log analysis is no longer entirely reactive. OpsPilot’s Coworker analyzes log patterns continuously alongside metrics and traces — not just when an engineer runs a query, but as part of the continuous intelligence layer that watches your production system.
When Coworker identifies a log pattern that is anomalous — a service generating an elevated error rate at low frequency, a log signature that preceded a previous incident appearing again, a correlation between a log event and a metrics pattern trending toward a situation — it surfaces this as a situation before an engineer needs to notice it. The insight that would previously have required a manual log query and pattern recognition from an experienced engineer arrives automatically, without being asked for.
This is the substantive difference between a log storage platform and an AI SRE observability platform. The first stores logs and makes them queryable. The second watches the logs continuously and tells you what matters.
For more on what Coworker watches across metrics, logs, and traces simultaneously, see the log management page and the proactive AI page.
Ready to see what AI log analysis finds in your stack? Start your free trial at app.opspilot.com/sign-up — no credit card required.
The OpenTelemetry Log Pipeline
For teams that have adopted OpenTelemetry for metrics and traces but have not yet standardized log collection through OTLP, the log management picture is incomplete. Without correlated log collection through the same OTLP pipeline, logs sit in a separate silo — queryable independently, but not automatically correlated with the traces and metrics from the same request or service window.
Unified log collection through OpenTelemetry’s log data model, with trace context propagation, makes log entries correlation-ready. A log error entry that includes the trace ID of the request that generated it is automatically correlatable with the trace span and the metrics from the same service at the same time. An AI SRE platform receives this correlated telemetry and can include log evidence in situation analysis without requiring the engineer to manually cross-reference log queries against trace views.
As we covered in OpenTelemetry Maturity, teams at Stage 2 — unified OTLP for metrics and traces — who have not yet added structured log collection to the pipeline are one instrumentation change away from the full correlated telemetry that makes AI SRE log analysis most effective.
For teams using Grafana and Loki as their log backend, the integration path is straightforward — the OTLP Collector routes logs to Loki as before and additionally to Coworker. Nothing changes for the existing Grafana log queries. As we covered in Grafana AI SRE, this is the additive intelligence layer model that characterizes OpsPilot’s approach.
Frequently Asked Questions
No. Coworker receives your log telemetry through the OTLP pipeline alongside your existing log backends — Loki, Elasticsearch, or any other destination you route logs to. Your existing log query and exploration tools remain unchanged. Coworker adds continuous analysis that surfaces patterns automatically; it does not replace the investigation tooling your engineers use when they need to explore log data in depth.
Not necessarily before — but Coworker will help you identify where verbosity reduction is worthwhile. One of the cost optimization situations Coworker surfaces is log volume anomalies relative to traffic baseline: services generating log volume disproportionate to their request rate are a reliable indicator of verbosity configuration that has drifted from operational need. You can act on Coworker's recommendations progressively rather than needing a pre-connection audit.
Structured logs — with consistent field schemas and trace correlation — significantly improve Coworker's ability to correlate log events with metrics and traces from the same service window. Unstructured logs can still be analyzed for volume patterns and anomaly detection, but structured logs enable the cross-signal correlation that produces the most specific situation output. If your team is on OTLP for metrics and traces but not yet for logs, moving to structured OTLP log collection is the highest-value instrumentation change available.
Log alerting rules fire when a specific pattern appears — a defined error string, a threshold error rate. They are reactive and require the alert condition to be anticipated and configured in advance. AI log analysis watches for patterns that deviate from established baselines, including patterns that weren't anticipated when the alerting rules were written. A log signature that has never appeared before, appearing at increasing frequency, is visible to Coworker as an anomaly even without a pre-configured alert rule for it.
See what AI log analysis finds in your stack. No rules to configure.
Start your free trial → app.opspilot.com/sign-up Or talk it through: Book a demo → calendly.com/fusionreactor-sales/opspilot-demo
OpsPilot is the AI SRE teammate for teams using OpenTelemetry, Prometheus, Grafana, and existing observability stacks — helping engineers investigate incidents, find root cause, and move toward autonomous operations without replacing their tools. OpsPilot, formerly FusionReactor Cloud, is Intergral’s AI-powered observability and AI SRE platform.