
Observability Cost: The Hidden Waste in Data You Never Query
Observability cost is one of the fastest-growing line items in engineering budgets — and most of the waste in it is invisible without systematic analysis.
The visible portion of observability cost is easy to see: the platform subscription, the log ingestion bill, the APM licence. Engineering leaders can point to these numbers and defend or challenge them in budget conversations. What is harder to see — and harder to challenge — is the cost within those numbers that is producing no operational value.
Most observability platforms charge on data volume: metrics cardinality, log ingestion bytes, trace storage. Data is collected continuously from all instrumented services. The platform stores it. Engineers query a fraction of it — the dashboards they check, the metrics they alert on, the logs they pull during incidents. The rest accumulates. The bill reflects all of it.
For most engineering teams running a mature observability stack, a meaningful proportion of their site reliability engineering (SRE) observability cost is being spent on data that nobody queries. Not because the instrumentation was wrong, but because the telemetry footprint has grown faster than the analytical attention available to use it.
This post is about where that waste typically sits, how to find it systematically, and what AI SRE does to surface it without requiring a dedicated cost optimization project.
The Three Categories of Observability Cost Waste
Observability cost waste concentrates in three specific categories. Understanding them is the starting point for any systematic reduction effort.
High-cardinality metrics that are never queried
Metrics cardinality — the number of unique time series stored — is the primary driver of observability cost on metrics-based platforms. A metric with 10 label dimensions, each with 10 possible values, produces up to 10 billion potential time series. In practice, the explosion is less dramatic, but cardinality accumulates quickly as services are instrumented with labels that seemed useful at the time.
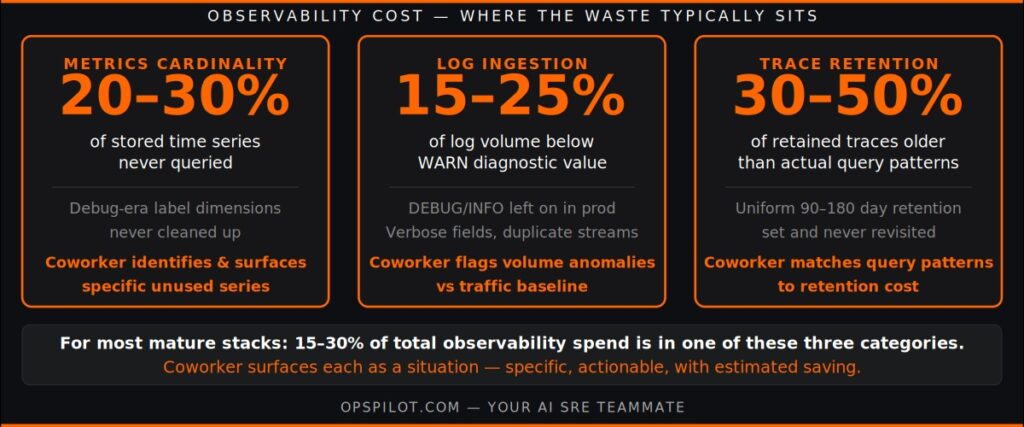
The cost problem is that cardinality is charged regardless of whether the time series are queried. A high-cardinality metric that was configured for a debugging session six months ago and never cleaned up is generating cost continuously. For most mature observability stacks, a meaningful proportion of stored metrics time series — often 20-30% — are never or rarely queried.
Identifying these requires systematic analysis of query patterns against stored series — work that is valuable but time-consuming to do manually, and rarely prioritized until the bill forces the issue.
Log ingestion beyond diagnostic value
Log ingestion is typically the second-largest observability cost driver. Platforms charge on ingested volume, and log volume grows with service activity — more traffic, more logs. The cost problem is that log verbosity is often set for debugging convenience rather than operational necessity, and verbose configurations that made sense during development become expensive habits in production.
The most common waste patterns: DEBUG and INFO log levels left enabled in production services where only WARN and ERROR are operationally relevant; structured log fields that add cardinality without adding diagnostic value; duplicate log streams where the same events are ingested to multiple destinations; and log retention periods set uniformly rather than by diagnostic value.
As we covered in Telemetry Volume Goes Up Every Year, the default trajectory for log costs is upward. The reduction levers are available but require systematic identification of where volume is being generated without corresponding value.
Trace retention beyond incident relevance
Distributed traces are the highest-value and highest-cost telemetry type. The cost problem with traces is retention: most incident investigation requires only traces from the incident window and a short baseline period before it. Traces older than 30 days are rarely queried outside of anomaly investigations that could be triggered on demand.
Most teams set trace retention uniformly — 90 days, 180 days — based on compliance defaults or conservative estimates rather than actual query patterns. Systematic analysis of trace query patterns against retention costs typically reveals that a significant proportion of trace storage is being retained for queries that never happen.
What AI SRE Does for Observability Cost
The manual approach to observability cost optimization is a periodic audit: pull query logs, analyze what is and isn’t being queried, identify the waste, remediate it. This is valuable and rare in practice — it requires dedicated engineering time that is consistently deprioritized relative to incident response and feature work.
OpsPilot’s Coworker approaches observability cost differently. As part of its continuous analysis of your telemetry, Coworker watches for cost optimization opportunities and surfaces them as situation—specific findings with specific recommended actions, delivered to Slack alongside reliability situations.
Unused high-cardinality metrics: Coworker identifies metric series that have not been queried within a configurable window and are contributing meaningfully to your cardinality cost. The situation includes the specific metric name, the label dimensions driving cardinality, the estimated cost contribution, and a recommended action — typically reducing label cardinality or dropping the series entirely.
Log volume anomalies: Coworker identifies services where log ingestion volume has increased significantly relative to traffic levels — a common indicator of a verbosity configuration that has drifted from its intended setting. The situation includes the affected service, the volume delta, the estimated cost impact, and a recommended configuration change.
Retention optimization opportunities: Coworker analyzes query patterns against retention costs and surfaces situations where retention periods are materially longer than actual query patterns would justify — with specific retention recommendations and estimated savings.
The difference from a periodic audit is continuity. Coworker surfaces these situations as they develop — as a metric accumulates unqueried cardinality, as a service’s log verbosity increases, as retention costs grow relative to query patterns — rather than in a snapshot that is already months out of date by the time it informs action.
For teams running significant observability stacks, the cost savings surfaced by Coworker’s continuous cost analysis typically offset a meaningful portion of the platform cost. As we covered in How To Defend Your Observability Budget in 2026, the investment case for AI SRE is strongest when both reliability improvement and cost optimization are counted — not just one or the other.
Ready to see what Coworker finds in your observability spend? Book a demo at calendly.com/fusionreactor-sales/opspilot-demo
Making the Observability Cost Case to Leadership
Observability cost reduction is one of the clearest business cases for AI SRE because the savings are directly measurable. Unlike reliability improvement — where the value is incidents prevented and therefore invisible — cost reduction appears directly in the bill.
The framework for presenting observability cost optimization to leadership:
Current spend visibility: What does the observability stack actually cost in total — platform subscription, log ingestion overages, trace storage, and engineering time spent on manual investigation? Most engineering leaders can answer the first number but not the others.
Waste identification: What proportion of current spend is producing no operational value? The three categories above are the starting point. For most mature observability stacks, 15-30% of total spend falls into one of these categories.
Reduction roadmap: What specific actions reduce the waste, and what is the estimated saving from each? This is where Coworker’s situation output is directly useful — each cost situation includes the recommended action and the estimated saving, giving leadership a concrete reduction roadmap rather than a general aspiration.
Reinvestment case: The AI SRE investment that surfaces these savings pays for itself and then some — and also improves reliability outcomes, reduces on-call burden, and reduces investigation time. The observability cost case is a door into a broader operational improvement conversation.
See the pricing page for OpsPilot’s tier comparison — no form, no sales call. For more on the full operational cost picture, see The Hidden Cost of Manual Incident Investigation and Operational Resilience 2026.
Frequently Asked Questions
No. Coworker identifies cost optimization opportunities from your telemetry data itself — analyzing query patterns, cardinality, volume trends, and retention against what is actually being used. It does not require access to your platform billing or account data. The cost estimates it surfaces are based on typical pricing models for the telemetry types involved, not your specific contract rates.
The savings vary substantially by team and stack maturity. Teams that have never done a systematic cost optimization audit typically find the largest opportunities — 15-25% of total observability spend is a reasonable expectation for a mature stack that has grown organically. Teams that have recently optimized will find smaller but still meaningful ongoing opportunities as the stack continues to evolve.
It depends on which metrics and logs are reduced. Coworker's recommendations target data that is not being queried — which by definition is not currently contributing to incident investigation. The risk of false economy (reducing data that turns out to be needed during an unusual incident) is addressed by targeting series and log types with sustained zero or near-zero query rates rather than low but non-zero query rates.
Coworker's cost situation output is compatible with most FinOps workflows — the specific findings, estimated savings, and recommended actions can be fed into existing cost governance processes. For teams with formal FinOps practices, Coworker adds continuous telemetry-specific cost monitoring to what is often a more infrastructure-focused existing practice.
Find the waste in your observability spend. Automatically.
Book a demo → calendly.com/fusionreactor-sales/opspilot-demo
Or start today: Free trial → app.opspilot.com/sign-up
OpsPilot is the AI SRE teammate for teams using OpenTelemetry, Prometheus, Grafana, and existing observability stacks — helping engineers investigate incidents, find root cause, and move toward autonomous operations without replacing their tools. OpsPilot, formerly FusionReactor Cloud, is Intergral’s AI-powered observability and AI SRE platform.