
Operational Resilience 2026: What It Actually Means — And How Engineering Teams Measure It
Operational resilience 2026 is not the same as uptime.
Engineering leaders who present uptime numbers to business stakeholders increasingly find that the conversation moves quickly past the metric. 99.9% uptime is 8.7 hours of downtime per year. 99.95% is 4.4 hours. These numbers are real, but they tell leadership very little about the operational health of the system, the maturity of the team, or the trajectory of reliability improvement over time.
The business questions that leadership is actually asking are different. How often do we have incidents? When we do, how long do they last and what do they affect? Are we getting better or worse? What would a significant incident cost us? What are we doing to prevent the next one?
Operational resilience in 2026 means being able to answer those questions with data — not with confidence, not with stories, but with numbers that leadership can track across quarters and connect to investment decisions.
This post is about how engineering leaders define operational resilience, the four metrics that actually measure it, and how AI site reliability engineering (AI SRE) improves it in ways that are visible to the business — not just to the engineering team.
Why Uptime Fails as an Operational Resilience 2026 Metric
Uptime is a lagging indicator. It tells you what happened to availability after a period of time. It does not tell you:
- How many incidents occurred that affected availability but were resolved quickly enough not to register significantly in the percentage
- How many potential incidents were prevented entirely through proactive operations
- What the trend in incident frequency is — improving, stable, or deteriorating
- How much engineer time was consumed by reactive firefighting versus proactive reliability work
- What the operational health of the system is right now
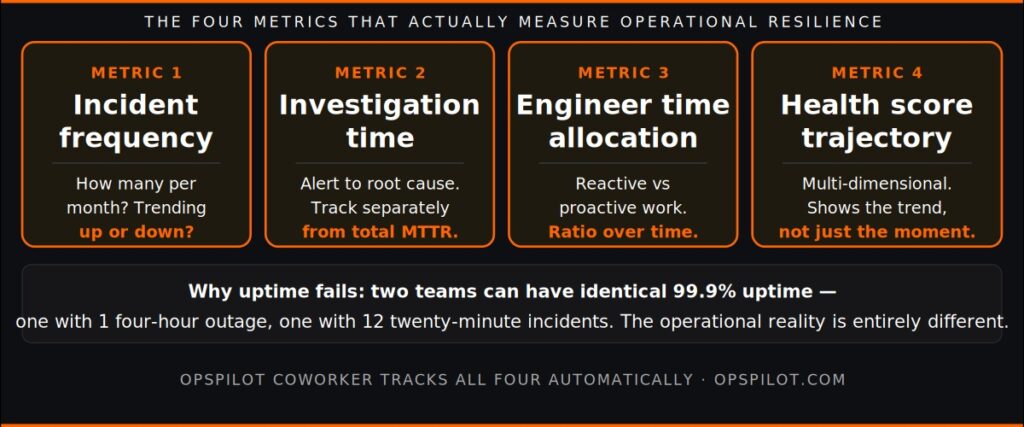
A team that has one significant 4-hour outage per year has the same uptime as a team that has twelve 20-minute incidents per year. The uptime number is identical. The operational reality is entirely different. The second team is spending far more engineering time on reactive work, carrying far more on-call burden, and experiencing far more customer-facing disruption — even though the metric looks the same.
Operational resilience 2026 requires better metrics than uptime. The good news is that the right metrics are available for teams running a modern observability stack with an AI SRE intelligence layer.
The Four Metrics That Actually Measure Operational Resilience
1. Incident frequency — not just duration
MTTR (mean time to resolution) measures how quickly incidents are resolved. It is a useful metric but an incomplete one. A team that reduces MTTR from 90 minutes to 20 minutes has improved significantly — but a team that prevents three incidents per month from occurring at all has improved more fundamentally.
Incident frequency — how many significant incidents occur per month — is the leading indicator that MTTR misses. A declining incident frequency, even with stable MTTR, indicates that the team is catching more problems before they escalate. This is the operational resilience metric that AI SRE moves most directly.
OpsPilot’s Coworker tracks the ratio of situations resolved proactively to incidents that escalated and fired alerts. This ratio — the proactive resolution rate — is the clearest indicator of whether a team is moving from reactive to proactive operations, as described in From Firefighting to Prevention.
2. Mean time to resolution — with investigation time separated out
MTTR matters, but the most actionable component of MTTR is the investigation phase — the time from alert to root cause identification. This phase accounts for the majority of total incident time and is the component most directly addressable by AI SRE.
Teams running Coworker consistently report investigation time dropping from 60-90 minutes to 10-15 minutes as Coworker’s correlation work replaces manual orientation. Tracking investigation time as a separate metric — rather than folding it into total MTTR — makes the AI SRE contribution measurable and visible.
3. Engineer time allocation — reactive vs proactive
How much of your SRE team’s time goes to reactive work (alert triage, dashboard review, incident investigation) versus proactive work (reliability architecture, SLO management, instrumentation improvement)?
For most teams without an AI SRE layer, reactive work consumes 40-50% of SRE time. As we covered in What an AI SRE Teammate Actually Does, this is the work that an AI SRE handles automatically — freeing engineer time for the proactive reliability investment that produces long-term operational resilience improvement.
Tracking this ratio over time — what percentage of SRE time is proactive versus reactive — gives leadership a measurable indicator of team maturity and operational resilience trajectory.
4. Health score trajectory
OpsPilot’s health scoring tracks operational quality across multiple dimensions — performance, error rate management, cost efficiency, alerting quality, and instrumentation coverage — and produces a composite score that changes over time.
A health score that moves from 64 to 79 over a quarter is a visible indicator of operational resilience improvement that uptime alone does not capture. It shows the trend. It connects engineering investment to measurable outcomes. It gives leadership the trajectory data that budget decisions require.
Ready to make operational resilience visible to your business? Book a demo at calendly.com/fusionreactor-sales/opspilot-demo
What AI SRE Does to Operational Resilience
The connection between AI SRE and operational resilience is direct: AI SRE addresses the root causes of poor operational resilience rather than treating the symptoms.
Poor operational resilience symptom: High incident frequency.
AI SRE response: Proactive pattern detection catches failure precursors before they cross alert thresholds. Incident frequency declines as more problems are resolved proactively.
Poor operational resilience symptom: Long investigation time.
AI SRE response: Coworker does the correlation and orientation work automatically. Investigation time drops from 60-90 minutes to 10-15 minutes.
Poor operational resilience symptom: High on-call burden and engineer burnout.
AI SRE response: Fewer alerts that require reactive response. Better context when alerts do fire. On-call experience improves measurably. As we covered in SRE On-Call 2026, the 2am pages that reduce the next day’s engineering quality are the most preventable incidents.
Poor operational resilience symptom: Invisible operational quality — no trend data to show leadership.
AI SRE response: Health scoring provides continuous, multi-dimensional operational quality tracking. The trajectory is visible. The investment in reliability produces numbers that leadership can see.
Connecting Operational Resilience 2026 Metrics to Business Outcomes
The budget conversations that engineering leaders have with leadership are most effective when operational resilience is connected to business outcomes rather than technical metrics.
The translation is straightforward:
- Incident frequency → customer-facing disruptions, support ticket volume, contractual SLA exposure
- MTTR / investigation time → engineering cost per incident, total annual cost of reactive operations
- Engineer time allocation → productive engineering capacity available for product work
- Health score trajectory → directional indicator of reliability investment return
As we covered in How To Defend Your Observability Budget in 2026, the teams that win budget conversations are the ones with this data. The AI SRE investment is justified not by the capability it adds but by the operational resilience improvement it produces — and the business cost that improvement avoids.
For more on the operational resilience capability, see the AI SRE page and the proactive AI page.
FAQ
Is operational resilience the same as reliability?
They are related but distinct. Reliability typically refers to the availability and correctness of a system. Operational resilience is broader — it encompasses how the team responds to and recovers from disruption, how quickly it improves operational quality over time, and how visible that improvement is to the business.
What is a good operational resilience health score?
OpsPilot’s health scoring is specific to your system and improves as Coworker learns your baselines. A useful starting point is the trajectory rather than the absolute number — a consistent upward trend over a quarter indicates genuine operational resilience improvement regardless of the starting point.
How do we report operational resilience to non-technical leadership?
The most effective approach is cost-to-outcome framing: incidents prevented multiplied by the average cost of an incident, plus engineer time saved on investigation, plus cloud cost optimizations surfaced. See How To Defend Your Observability Budget for the full framework.
How long before operational resilience metrics show meaningful improvement?
Most teams running OpsPilot’s Coworker report measurable improvement in incident frequency within the first month. Investigation time improvements are typically visible within the first week. Health score trajectory becomes meaningful over a quarter as baselines mature.
Make operational resilience visible to your business.
Book a demo → calendly.com/fusionreactor-sales/opspilot-demo
Or explore first: Start your free trial → app.opspilot.com/sign-up
OpsPilot is the AI SRE teammate for teams using OpenTelemetry, Prometheus, Grafana, and existing observability stacks — helping engineers investigate incidents, find root cause, and move toward autonomous operations without replacing their tools. OpsPilot, formerly FusionReactor Cloud, is Intergral’s AI-powered observability and AI SRE platform.