
What Happens in the 22 Minutes Between Your Alert Firing and Root Cause
The alert fires at 14:21. Your on-call engineer’s phone buzzes. They are 40 minutes into a sprint planning session and they are now mentally somewhere else.
They open Slack, find the alert, and start investigating. They open Grafana. They pull up the payment service dashboard. The connection pool metric is at 87% — above the 85% threshold that triggered the page. They note the time the spike started: around 14:03. Eighteen minutes ago. They switch to the log view and start scrolling. There is a lot happening. The batch job is in there somewhere.
By 14:43 — 22 minutes after the alert fired — they have identified the root cause: the payments reconciliation batch job processed an unusually large dataset this afternoon and saturated the connection pool it shares with the payment service. The fix is to reduce the batch job’s thread concurrency from 8 to 4. They apply it. The pool begins recovering at 14:46.
Total investigation time: 22 minutes. The payment service was degraded for 43 minutes in total, from 14:03 when the pressure began to 14:46 when recovery started. Some checkout requests failed. The on-call engineer missed the rest of sprint planning.
Here is the same incident with ai observability proactive detection running.
14:03 — The Pattern Begins. Coworker Watches.
The batch job starts its scheduled run. Coworker sees the connection pool metrics shift — utilization moving from 45% toward 52%. Not anomalous yet. But Coworker’s baseline for Tuesday afternoons at this traffic level puts typical utilization between 40-50%. It begins watching the rate of change.
This is the first realistic thing to understand about proactive detection: Coworker does not raise a situation at the first data point. It needs enough evidence to be confident that a deviation is real and not noise. A gradual pressure build like this takes time to confirm.
14:15 — Correlation
By 14:15, connection pool utilization has reached 71% and has been climbing consistently for 12 minutes. Coworker is now confident this is not noise.
It correlates across signals. The trace data shows incoming requests completing normally — no user-visible degradation yet. The log stream shows the batch job is processing 340,000 records, versus its typical 180,000. The log entry is structured and includes the job ID and record count. Coworker checks the dependency map and confirms that the batch job and payment service share the same database connection pool — a configuration it flagged as a potential contention risk in a gap situation three weeks ago.
The picture assembles: large batch run, shared pool, pressure building toward the 85% alert threshold at the current rate of climb.
One realistic caveat here: this correlation depends on the batch job producing structured logs with enough attribution to connect the log entry to the service context. Teams whose batch jobs log in unstructured freeform text get a less complete picture. The log quality is doing real work in this scenario.
14:19 — The Situation Is Raised
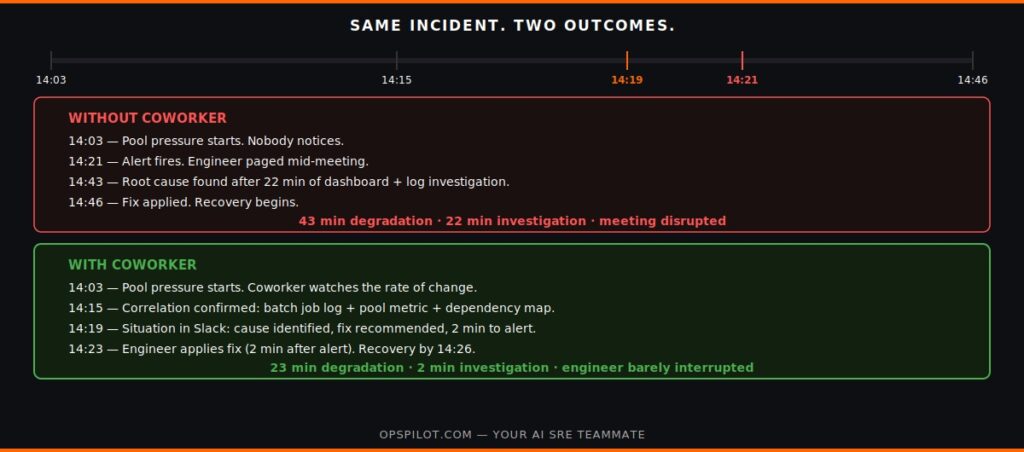
At 14:19 — two minutes before the alert fires — Coworker raises a situation in the team’s #ops-situations Slack channel:
Situation: Connection pool pressure — payment service
Pool utilization: 79% and climbing (baseline: 43% at this time of day)
Correlated signals: Batch jobpayments-reconciliationprocessing 340k records (typical: 180k). Shared pool configuration — contention likely.
Recommended action: Reduce batch job concurrency from 8 to 4 threads. Estimated pool recovery: 8-12 minutes.
Estimated time to alert threshold at current rate: ~2 minutes.
Historical context: Similar pattern observed. Batch jobs with oversized datasets have caused pool pressure previously. Same recommended action applied both times.
The on-call engineer sees this in Slack at 14:19. Two minutes later, at 14:21, their phone buzzes with the alert. But they already know what it is, why it happened, and what to do about it.
They apply the fix at 14:23. Two minutes after the alert fired. Pool recovery begins at 14:26.
The Actual Difference
Total investigation time with Coworker: 2 minutes — the time to read the situation and apply the fix.
Total investigation time without Coworker: 22 minutes — dashboards, log scrolling, pattern recognition, root cause identification, fix application.
The payment service was degraded from 14:03 to 14:26 with Coworker — 23 minutes, with a 2-minute investigation.
Without Coworker, degradation ran from 14:03 to 14:46 — 43 minutes, with 22 minutes of active investigation eating into engineer time and sprint planning.
Coworker did not catch this before the alert fired. It fired 2 minutes after Coworker’s situation. What Coworker did was arrive at the same moment as the alert but with a complete investigation picture rather than a raw threshold breach. The 20-minute difference was in investigation time, not detection time.
This is the honest version of what ai observability proactive detection delivers in a scenario like this one. The “before the alert fires” outcome happens too — for patterns that develop slowly enough for the confirmation window to clear before the threshold is crossed. But the more reliable and consistent value is the pre-assembled investigation context that makes the alert actionable immediately rather than the start of a 20-minute investigation.
What Made This Work — And What Could Have Broken It
Three things enabled the 2-minute investigation. Each one is also a dependency that has to be in place.
Unified telemetry. Coworker could correlate the batch job logs, the connection pool metrics, and the dependency map because all three were flowing through the same OTLP pipeline. Teams whose batch jobs run outside the instrumented perimeter would have seen the pool pressure but not the cause. The correlation that made the situation actionable came from the log entry.
Structured logging. The batch job log entry was structured — it included the record count as a named field that Coworker could parse and reason about. A log line that said Processing batch job at 2026-08-19 14:03:21 would not have been enough. Log quality does real work here. As we covered in Observability Gap Detection, signal quality gaps are as consequential as signal absence.
Historical context. The “similar pattern observed previously” note in the situation came from incident memory — previous incidents of the same type, resolved the same way, recorded with structured contributing factors. Teams in their first few weeks with Coworker don’t have this yet. As we covered in AI SRE Incident Memory, baselines and incident memory are what make the detection increasingly specific and the recommendations increasingly accurate over time.
For how proactive detection fits into the broader shift from reactive to proactive operations, see Proactive SRE. For how the situation detection layer feeds into autonomous remediation for recurring patterns, see AI SRE Platform and Incident Management. The proactive AI page covers how Coworker’s continuous detection works. For pricing — no form, no sales call.
Frequently Asked Questions
Sometimes. For slowly developing patterns — memory leaks accumulating over hours, gradual database index degradation — Coworker will often surface the situation before the alert threshold is crossed. For faster-developing patterns or tightly configured alert thresholds, the situation may arrive around the same time as the alert. The consistent value in both cases is the pre-assembled investigation context that arrives with the situation — which is what turns a 22-minute investigation into a 2-minute action.
If the batch job has no telemetry, Coworker sees the pool pressure but cannot identify the cause from the signal evidence. It will still surface a situation — connection pool pressure approaching threshold, correlated with nothing visible in the telemetry — with a recommendation to investigate batch job scheduling as a likely cause based on the time pattern. The situation is less actionable, which is the honest cost of an instrumentation gap.
For basic deviation detection, useful baselines develop within 2-4 weeks of stable operation. For time-of-day awareness — detecting that 79% at 14:15 on a Tuesday is unusual while 79% at 9am peak traffic is normal — 4-6 weeks to calibrate well. The historical incident context requires that specific pattern to have occurred and been resolved at least once in a way that was captured in incident memory.
In this scenario, yes — an engineer is still needed to apply the fix. Coworker surfaces the situation and the recommendation; execution is human. For patterns that have been approved for autonomous remediation after sufficient recurrence and consistent resolution, Coworker can execute the fix without paging the engineer at all — the on-call engineer receives a Slack notification that the situation was detected and resolved autonomously.
See what Coworker surfaces when your next alert fires.
Start your free trial → app.opspilot.com/sign-up
Or talk it through: Book a demo → calendly.com/fusionreactor-sales/opspilot-demo
OpsPilot is the AI SRE teammate for teams using OpenTelemetry, Prometheus, Grafana, and existing observability stacks — helping engineers investigate incidents, find root cause, and move toward autonomous operations without replacing their tools. OpsPilot, formerly FusionReactor Cloud, is Intergral’s AI-powered observability and AI SRE platform.