
The Service Is Yours: Using OpsPilot Chat to Investigate Your Own Deployment
OpsPilot Chat Incident Investigation for Developers
It is 3:17pm on a Wednesday. Maya has just deployed a new version of the checkout service. She pushed it twenty minutes ago, ran the smoke tests, got green, and moved on to the next ticket.
At 3:24pm her team’s Slack channel gets a message from a customer success manager: “Hey — a few customers are saying checkout feels slow. Anyone know if something changed?”
Maya knows she changed something. She deployed twenty minutes ago. But “slow” is not a diagnosis. She needs to know whether it is her deployment, whether it is affecting all users or a subset, and whether the latency spike started exactly at deployment time or whether it was already trending before she pushed.
Six months ago, this would have been a 40-minute investigation. Open Grafana. Find the checkout service dashboard. Pull up the latency metrics. Compare before and after. Switch to the trace view. Filter by the new build tag. Check the downstream services. Ask the SRE lead for help reading the distributed trace.
Today, Maya opens OpsPilot Chat and types: “Did my checkout service deployment at 3:04pm cause the latency increase?”
What Chat Does With That Question
OpsPilot Chat incident investigation is not a search function. It does not return a list of dashboards to look at. It reads across the relevant telemetry — metrics, logs, traces — and returns a specific answer to a specific question about a specific service at a specific time.
The response Maya gets:
Yes, with high confidence. Checkout service p95 latency increased from 187ms to 412ms beginning at 15:04:32 — the timestamp of your deployment. The increase is consistent across all regions. Root of the change: the new payment validation middleware is making a synchronous call to the fraud-check service on every transaction. The fraud-check service p50 response time is 198ms. This is a new dependency introduced in this deployment — it was not present in the previous version.
Recommended action: Make the fraud-check call asynchronous for non-high-risk transactions, or add a 150ms timeout with fallback. Estimated effort: 2–4 hours.
The fraud-check service itself is healthy — error rate 0.1%, latency normal. The issue is the synchronous coupling, not the downstream service.
Maya didn’t open a single dashboard. She didn’t need to know which Grafana panel showed payment validation latency. She didn’t need to filter traces by build version. She didn’t need to ask the SRE lead what the distributed trace meant.
She got a root cause, a recommended fix, and an effort estimate in 40 seconds.
Why Developers Are the Right Audience for This
The assumption embedded in most observability tooling is that incident investigation is an SRE job. The dashboards are built for people who know how to read them. The trace viewer requires understanding of distributed systems. The alert routing delivers pages to on-call engineers.
This assumption creates a bottleneck. When a developer deploys something and it causes a problem, the investigation workflow looks like: developer notices → developer reports to SRE → SRE investigates → SRE routes back to developer → developer fixes. Each handoff takes time. The SRE is interrupted. The developer is waiting.
OpsPilot Chat incident investigation removes the handoff. The developer asks the question directly against their own telemetry and gets the answer. The SRE is not pulled in unless the situation genuinely requires their expertise.
This is not about replacing SREs. It is about giving developers the same investigative capability without requiring SRE-level observability expertise. The same way that a developer can push a deployment without understanding the CI/CD pipeline internals, they can investigate that deployment’s impact without understanding how to build a Prometheus query.
As we covered in OpsPilot Chat Observability, the Chat capability is designed specifically to work across all three signal types simultaneously — answering questions that would require multiple dashboard views to answer manually.
The Questions Developers Actually Ask
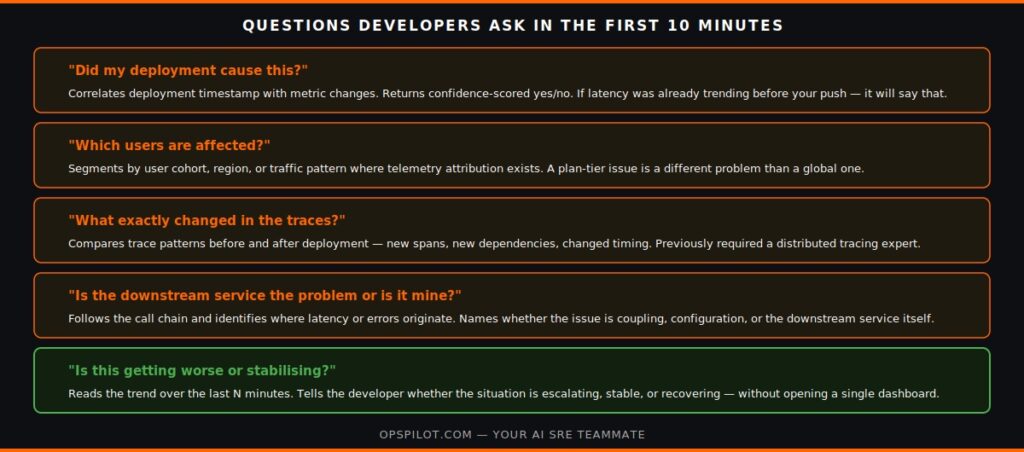
The questions that matter most in the first 10 minutes after a deployment are not complex. They are specific. And they are exactly what Chat is built for.
“Did my deployment cause this?” — The most important question. Chat correlates the deployment timestamp with metric changes and gives a confidence-scored answer. If the latency was already trending before the deployment, Chat will say that — and the developer can stop debugging the wrong thing.
“Which users are affected?” — Chat can segment by user cohort, region, or traffic pattern if the telemetry contains that attribution. A deployment that only affects users on a specific plan tier or in a specific region is a different problem than one affecting everyone.
“What exactly changed in the traces?” — Chat can compare trace patterns before and after a deployment, identifying new spans, new dependencies, or changed timing at the service level. This is the question that would previously require a distributed tracing expert to answer.
“Is the downstream service the problem or is it mine?” — Chat follows the call chain and identifies where the latency or errors originate. If the downstream service is healthy and the issue is in the coupling — as in Maya’s case — Chat names that clearly.
“Is this getting worse or stabilising?” — Chat can read the trend over the last N minutes and tell the developer whether the situation is escalating, stable, or recovering on its own.
These questions are not what observability dashboards are designed to answer quickly. Dashboards require the person asking to already know where to look. Chat requires them to know what they want to know.
What Happens After the Investigation
In Maya’s scenario, the Chat response gave her everything she needed to fix the problem. But Chat also feeds into the broader Coworker incident workflow — the situation is logged, the resolution is recorded, and if this pattern recurs in a future deployment, Coworker will surface the historical context automatically.
As we covered in AI SRE Incident Memory, every Chat investigation and every Coworker situation contributes to the operational knowledge base. The next developer who introduces a synchronous dependency on a slow downstream service will get a situation surfaced proactively — Coworker will have seen this pattern before.
This is the compounding value of Chat as an investigation tool: every question answered improves the detection of the same pattern in the future.
For the coverage gaps that limit what Chat can see, see Observability Gap Detection. For how developers should think about Coworker mode configuration, see Coworker Modes.
The cost of the 40-minute manual investigation multiplied across a team is covered in The Hidden Cost of Manual Investigation. The pricing page covers plan details — no form, no sales call.
Frequently Asked Questions
Chat is available to any team member with access to OpsPilot — no separate configuration is required beyond the initial OTLP connection that brings telemetry into the platform. Once the telemetry is flowing, any team member can ask questions against it through Chat. The quality of Chat's answers depends on the completeness of the telemetry — a service with metrics, logs, and traces produces more complete answers than one with metrics only.
Both. Chat is available continuously and can be used at any point — during an active incident to rapidly identify root cause, immediately after a deployment to verify whether a problem was introduced, or retrospectively to understand what happened in a previous incident. The telemetry history that Chat queries is retained across the period covered by your plan.
Chat will tell you what it can and cannot see. If a service is uninstrumented or if a trace breaks before reaching the relevant service, Chat will identify the gap — "I can see latency increased in the checkout service but the trace terminates before reaching the payment validation service, which appears uninstrumented" — rather than returning an incomplete answer without flagging the limitation.
Yes. Chat has visibility across all instrumented services in your OpsPilot account, regardless of which team owns them. A developer can ask questions about a downstream service they depend on without needing that team's dashboard access. Access controls at the OpsPilot account level govern what telemetry is visible — within those controls, Chat works across service boundaries.
Ask your stack what happened. Get a root cause, not a dashboard.
Start your free trial → app.opspilot.com/sign-up
Or talk it through: Book a demo → calendly.com/fusionreactor-sales/opspilot-demo
OpsPilot is the AI SRE teammate for teams using OpenTelemetry, Prometheus, Grafana, and existing observability stacks — helping engineers investigate incidents, find root cause, and move toward autonomous operations without replacing their tools. OpsPilot, formerly FusionReactor Cloud, is Intergral’s AI-powered observability and AI SRE platform.