
OpsPilot Chat Observability: What It Means to Ask Your Stack a Question in Plain English
OpsPilot Chat observability changes the fundamental model for how engineers query their production systems. Every observability platform in 2026 can answer questions about your production system. The catch is that you have to ask them in the right language. PromQL for Prometheus metrics. LogQL for Loki logs. Trace filter syntax for Tempo or Jaeger. Each query language is learnable — but each requires context-switching into a different mental model, and none of them is the language engineers think in when an incident is happening.
When an engineer is investigating why checkout latency spiked at 14:23, they are not thinking in PromQL. They are thinking: “which services were slow, and what changed just before it started?” That question is natural language. Translating it into a PromQL query requires knowing the metric names, the label structure, the aggregation functions, and the time range syntax — before you can even ask the question, let alone interpret the answer.
OpsPilot Chat is a different model. It lets engineers query their production telemetry in plain English — no query language, no filter syntax, no metric name recall. The engineer types the question. Coworker translates it, queries the relevant telemetry sources, and returns a specific, structured answer.
This post is about what OpsPilot Chat observability actually changes in practice — not the concept of natural language querying, but the specific operational situations where asking your stack a question in plain English produces meaningfully better outcomes than the alternative.
The Query Language Problem in Observability
Query languages are a necessary layer of observability platforms — the mechanism by which stored telemetry becomes accessible for investigation. PromQL, LogQL, and trace query interfaces are functional, well-documented, and widely understood by experienced SREs.
They are also a barrier for every engineer who isn’t an experienced SRE. For a developer who caused an incident with a deployment and needs to investigate their own service, PromQL is a prerequisite they may not have. For a new engineer on an unfamiliar service during a 2am incident, recall of the correct metric labels under pressure is unreliable. For a team lead asking “how was our error rate last week?” the answer requires someone who knows how to write the query.
The query language barrier has two operational consequences. First, it creates a skills dependency — investigation capability is concentrated in the engineers who know the query languages, reducing the team’s collective ability to investigate incidents in parallel. Second, it adds latency to every investigation — the time to translate a natural language question into a syntactically correct query is time before the actual answer arrives.
As we covered in AI Incident Investigation, the investigation phase is where the majority of incident duration is spent. Query language friction is a component of that investigation time that is rarely measured but consistently present.
What OpsPilot Chat Actually Does
OpsPilot Chat operates as a query layer above your OTLP telemetry — receiving questions in plain English, translating them to the appropriate telemetry queries across metrics, logs, and traces, and returning structured answers rather than raw query results.
What you can ask
Service performance questions. “What was the p95 latency for the payment service in the last four hours?” “Which services had the highest error rate yesterday?” “When did checkout response time start degrading?” These translate directly to metrics queries across your Prometheus data without requiring the engineer to know the metric name or label structure.
Log investigation questions. “Show me error logs from the order service in the last 30 minutes.” “What log events appeared just before the payment service started returning 500 errors?” These translate to LogQL queries against your Loki data without requiring knowledge of log field names or label matchers.
Trace investigation questions. “Which requests to the checkout service took more than 2 seconds in the last hour?” “What downstream services did the slow requests hit?” These translate to trace queries against your Tempo or Jaeger data. As we covered in Distributed Tracing 2026, trace data contains significantly more information than most teams extract from it — Chat makes more of that information accessible without requiring trace query expertise.
Cross-signal correlation questions. The most powerful OpsPilot Chat queries cross signal boundaries — questions that would require running three separate queries and manually correlating the results without Chat. “Was there a spike in error logs from the payment service around the same time as the p95 latency increase?” These are the questions engineers ask during incidents that currently require significant investigation time to answer.
How OpsPilot Chat Changes Incident Investigation
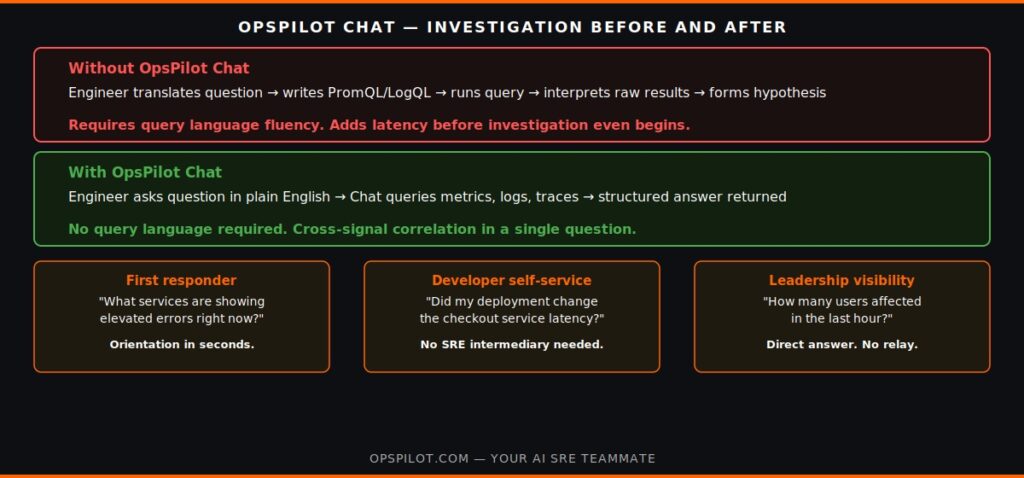
The operational impact of OpsPilot Chat is most visible in three specific incident investigation scenarios.
Scenario 1: First responder orientation
When an engineer is paged for an incident, the first several minutes are orientation — understanding what is affected, what the scope is, and where to start investigating. With OpsPilot Chat, the orientation happens as a conversation: “What services are currently showing elevated error rates?” “When did this start?” “What changed in the checkout service in the last two hours?” The engineer arrives at a working investigation hypothesis significantly faster than the dashboard-scanning alternative.
Scenario 2: Developer self-service investigation
Developers who deploy services are frequently involved in incident investigation for their own code — but many developers are not fluent in PromQL or LogQL. OpsPilot Chat makes developer self-service investigation practical. A developer can ask “are there any error logs from my service in the last hour?” without needing to know the underlying query syntax, reducing the SRE team’s investigation bottleneck.
Scenario 3: Leadership and non-technical stakeholders
During significant incidents, engineering leaders often need visibility into status that requires querying telemetry. OpsPilot Chat allows these questions to be asked directly — “what is the current error rate on the checkout service?” “how many users have been affected in the last hour?” — without requiring an SRE intermediary.
For the Grafana teams that have dashboards covering most regular monitoring questions, OpsPilot Chat addresses the cases that don’t fit standard dashboard panels. As we covered in Grafana AI SRE, dashboards show what was anticipated when they were built — Chat answers what wasn’t anticipated.
Ready to ask your stack a question? Start your free trial at app.opspilot.com/sign-up — no credit card required.
OpsPilot Chat vs Coworker: Complementary, Not Competing
Coworker is proactive and continuous — it watches telemetry autonomously, surfaces situations before engineers ask, and pre-assembles investigation context. Coworker is the layer that catches 60-70% of incidents before they require reactive response.
OpsPilot Chat is reactive and on-demand — it answers questions the engineer asks, when they ask them. Chat is the layer that makes investigation faster and more accessible when reactive response is required.
The two capabilities together cover the full incident investigation surface. Coworker eliminates the majority of incidents. Chat makes the remainder faster to investigate and accessible to engineers who wouldn’t previously have had direct investigation capability.
For the full Coworker capability set and how Chat fits within the OpsPilot platform, see the Coworker page and AI SRE page. For pricing — no form, no sales call — see the pricing page.
Frequently Asked Questions
Yes. OpsPilot Chat queries your existing OTLP telemetry through the same pipeline that Coworker uses. Your Prometheus metrics, Loki logs, and Tempo or Jaeger traces are all queryable through Chat without any additional configuration beyond the initial OTLP connection. Chat is available from day one of the trial alongside Coworker's proactive detection.
When a question is ambiguous — when "the payment service" could refer to multiple services, or when the time range isn't specified — Chat asks a clarifying question before returning results. The clarification is minimal and targeted: "which environment did you mean — production or staging?" or "what time range should I look at?" The goal is to return a specific, useful answer rather than a broad result that requires further interpretation.
Yes. As well as returning direct answers, Chat can output the underlying query it used — allowing engineers to refine it, save it as a Grafana panel, or use it as a starting point for more complex investigation. This is a useful learning path for engineers who want to build their own query language fluency using Chat as a teaching tool.
The main constraint is the scope of your telemetry data — Chat can only answer questions that can be answered from the signals you have connected. Cross-signal correlation questions require that both signal types are present for the service in question. Within those constraints, Chat handles multi-part, time-ranged, cross-service questions as readily as simple single-metric lookups.
Ask your production stack a question. In plain English.
Start your free trial → app.opspilot.com/sign-up
Or talk it through: Book a demo → calendly.com/fusionreactor-sales/opspilot-demo
OpsPilot is the AI SRE teammate for teams using OpenTelemetry, Prometheus, Grafana, and existing observability stacks — helping engineers investigate incidents, find root cause, and move toward autonomous operations without replacing their tools. OpsPilot, formerly FusionReactor Cloud, is Intergral’s AI-powered observability and AI SRE platform.