
Grafana AI SRE: What Your Dashboards Can't Tell You — And What Changes When You Add Intelligence
Grafana is excellent at showing you what happened — but Grafana AI SRE is what shows you what’s forming.
Your dashboards surface the latency spike, the error rate increase, the memory climb. Your alert rules fire when configured thresholds are crossed. Your Loki queries return the log lines that explain the failure after the fact. For a mature Grafana setup, this is real capability — you can see what broke, when it broke, and what the system looked like at the time.
What Grafana cannot do is tell you what is forming. It cannot watch your telemetry continuously and surface the pattern that is trending toward an incident three hours from now. It cannot correlate signals across services without an engineer running the query. It cannot tell you whether the latency increase on the payments service is caused by the database index that has been degrading for four days, or the upstream dependency that is approaching its rate limit, or something novel that hasn’t matched a known pattern yet. It surfaces data. It does not form conclusions.
This is the Grafana gap. It is not a criticism of Grafana — dashboards and visualization are what Grafana is for, and it does them excellently. The gap is between what Grafana provides and what most site reliability engineering (SRE) teams need from their observability stack: not just the ability to see what happened, but continuous analytical intelligence that tells them what to address before it becomes an incident.
Grafana AI SRE — connecting OpsPilot’s Coworker to your existing Grafana and OTLP stack — is what closes that gap.
What Grafana Does and Doesn’t Do
Understanding where Grafana’s capability ends is important because the boundary is not always obvious. Grafana has added increasingly sophisticated features over recent releases — alerting improvements, Grafana Machine Learning, Sift for incident investigation, and Grafana IRM for incident management. These features genuinely improve what Grafana can do. They do not fundamentally change Grafana’s architecture as a query and visualization tool.
What Grafana does well
Visualization and exploration: Grafana’s dashboard system is mature, flexible, and widely adopted. Engineers can build panels that expose exactly the signals they care about, query their Prometheus, Loki, and Tempo backends with precision, and share dashboards that standardize visibility across the team.
Threshold-based alerting: Grafana’s alerting system routes alerts to Slack, PagerDuty, or any configured destination when defined conditions are met. With multi-dimensional alerting and silencing rules, it handles the standard alert management workflow well.
Post-incident investigation: When an incident occurs, Grafana’s query capabilities are excellent for incident investigation — pulling the relevant metrics window, correlating log lines, following trace spans. With the right dashboards, an experienced engineer can assemble the root cause picture.
What Grafana doesn’t do
Continuous autonomous analysis: Grafana’s alerting fires when a threshold condition is met. Between threshold crossings, Grafana is passive — it stores and visualizes what you query. There is no continuous analytical process watching for patterns that haven’t yet crossed a threshold.
Cross-signal correlation without human direction: Grafana can show metrics, logs, and traces from the same service. Correlating them — determining whether a latency spike is caused by a database issue visible in a different panel, or a dependency latency visible in trace spans, or a log error that appeared six hours earlier — requires an engineer to run the right queries in the right sequence.
Proactive situation surfacing: Grafana surfaces what you look at. It does not surface what you haven’t thought to look at. The memory growth trend that has been developing for a week on a service you haven’t opened a dashboard for recently will not alert until it crosses a threshold — if you have a threshold configured for it.
As we covered in AI Observability 2026, the distinction between a platform that surfaces data and a platform that delivers conclusions is the core evaluation question for AI observability. Grafana is in the first category. Coworker adds the second.
What Grafana AI SRE Adds
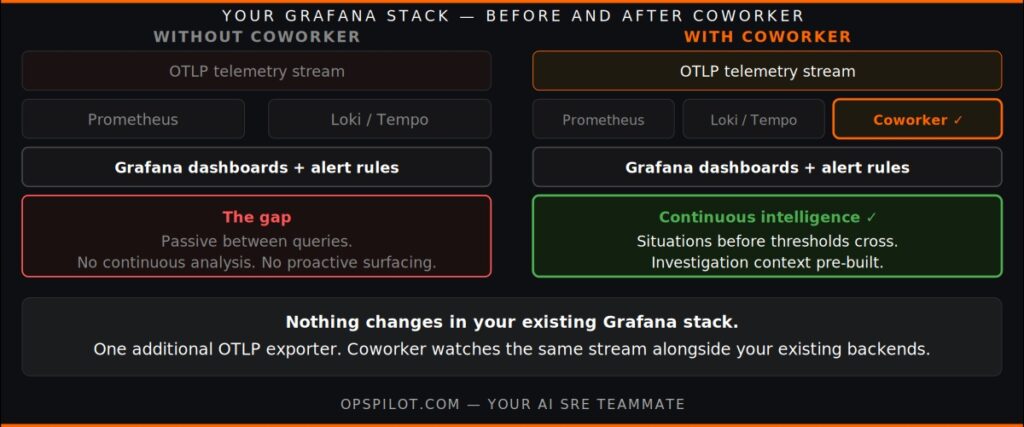
Adding Coworker to your existing Grafana stack does not change anything you have. Your OTLP pipeline continues. Your Prometheus backends continue. Your Grafana dashboards continue. Your alert rules and PagerDuty routing continue. Coworker is an additional consumer of your OTLP telemetry stream — the same data your Grafana backends receive, analyzed by Coworker’s continuous intelligence layer in parallel.
What changes is that between your engineers’ dashboard sessions, someone is watching.
Continuous pattern detection on your existing telemetry. Coworker analyzes your OTLP metrics, logs, and traces continuously — not when queried, not when an alert fires. The connection pool trending toward exhaustion at 2am on a Tuesday is a situation at midnight on Monday. The database query that has been degrading for four days is a situation on day two, not when it causes a latency spike visible in Grafana. The service that has been generating elevated error rates at a level too low to cross your alert threshold is a situation before it crosses.
Investigation context assembled automatically. When an incident occurs and an engineer opens Grafana to investigate, Coworker’s situation for the same incident provides the orientation they would otherwise assemble manually from multiple Grafana queries. The affected service. The correlated signals. The dependency chain. The specific recommended action. The estimated effort. This pre-assembled context reduces investigation time from 60-90 minutes of Grafana querying to 10-15 minutes of reviewing and acting.
Coverage gap identification. Coworker identifies services in your OTLP pipeline that have incomplete instrumentation — missing trace propagation, unstructured logs, services present in metrics but absent from traces. These coverage gaps limit both your Grafana dashboards and your Coworker detection. Surfacing them as situations gives your team a prioritized instrumentation roadmap.
The relationship between Grafana and Coworker is complementary rather than competitive. Grafana is the investigation and visualization tool your engineers reach for when they want to explore specific signals. Coworker is the intelligence layer that watches continuously and tells them which signals are worth exploring — and often tells them what those signals mean before they need to explore at all.
For teams already running Grafana on their OTLP data, the connection to Coworker is a single exporter configuration change. As we covered in OpenTelemetry Maturity, the Stage 2 team with unified OTLP is one exporter away from Stage 3 proactive detection.
Ready to add the intelligence layer to your Grafana stack? Start your free trial at app.opspilot.com/sign-up — no credit card required.
The Grafana AI SRE Stack in Practice
A concrete picture of what the combined Grafana and Coworker stack looks like in daily operation.
Morning: The on-call engineer opens Slack to find Coworker has surfaced two situations overnight. One is a warning: the checkout service connection pool has been climbing since 11pm and is at 71% with a trend toward exhaustion by mid-morning. Coworker’s recommendation: increase pool size from 20 to 30. Estimated effort: 10 minutes. The engineer opens the relevant Grafana dashboard to confirm the trend is visible, agrees with the assessment, and applies the change before standup. No alert has fired. No incident has occurred.
The second situation is an info: the orders service has been generating a recurring log error at low frequency — 0.4% of requests. Coworker has correlated this with a recent deployment and identified the specific code path. The engineer flags it for the team to address during the sprint.
During the day: Grafana dashboards are open in the background, as usual. Two new Coworker situations arrive during the afternoon — a memory growth trend on the auth service and a latency increase on a third-party API dependency. Both are watching status: not urgent, but being monitored. The engineer reviews and dismisses the API latency situation as expected behavior during the partner’s maintenance window. Coworker notes the dismissal and won’t surface the same pattern again during maintenance windows.
On-call overnight: One alert fires at 1am — a genuinely novel failure that Coworker’s proactive detection did not surface because there was no telemetry precursor. The on-call engineer opens the Coworker situation that was created when the alert fired. Coworker has already correlated the signals — the alert is caused by a database lock contention issue on a specific table. The Grafana link in the situation takes the engineer directly to the relevant dashboard panel. Investigation time: 11 minutes. The engineer is back asleep by 1:20am.
This is the Grafana AI SRE stack working as designed. Grafana for exploration and investigation depth when needed. Coworker for continuous watching and pre-built context when it matters.
For more on the specific capability set, see the Grafana AI SRE capability page and the proactive AI page.
Frequently Asked Questions
No. Your Grafana dashboards remain unchanged. Coworker connects to your OTLP pipeline as an additional telemetry consumer — it receives the same data your Prometheus and Loki backends receive. Your Grafana panels, alert rules, and visualization setup are unaffected. Coworker operates independently above the data layer, not within the Grafana interface.
Coworker does not replace or integrate with Grafana's alerting system — they operate in parallel. Grafana's alerts continue to fire on their configured thresholds and route to their configured destinations. Coworker surfaces situations proactively before thresholds are crossed, and when a Grafana alert does fire, Coworker's correlated situation provides the investigation context the engineer needs to act quickly.
No. Coworker connects to your OTLP endpoint, which operates the same way whether your Grafana deployment is self-hosted or cloud-based. Your Grafana Cloud instance continues to receive its telemetry stream as before. Adding Coworker is a single additional OTLP exporter in your OpenTelemetry Collector configuration, regardless of your Grafana deployment model.
Grafana Sift runs automated investigation when a Grafana alert fires — surfacing related signals and correlations within the Grafana interface. Coworker's investigation runs continuously upstream of alert-firing, building situation context before the threshold is crossed. When Coworker and Grafana are both in the stack, the Coworker situation typically already contains the investigation context that Sift would assemble after the alert fires — meaning the engineer arrives at root cause faster.
Add the intelligence layer to your Grafana stack. First situations in 24 hours.
Start your free trial → app.opspilot.com/sign-up
Or talk it through: Book a demo → calendly.com/fusionreactor-sales/opspilot-demo
OpsPilot is the AI SRE teammate for teams using OpenTelemetry, Prometheus, Grafana, and existing observability stacks — helping engineers investigate incidents, find root cause, and move toward autonomous operations without replacing their tools. OpsPilot, formerly FusionReactor Cloud, is Intergral’s AI-powered observability and AI SRE platform.