
Telemetry Volume Goes Up Every Year. So Does Your Bill. Here’s How To Break That Pattern
There is a conversation happening in engineering leadership teams right now that wasn’t happening three years ago.
It used to be that observability spend was invisible in the budget. A line item that nobody questioned because the tools were working, the engineers were happy, and the cost was modest relative to the value.
That is no longer the case for most organizations running modern production systems. Telemetry volume scales with system complexity, and system complexity scales with growth. Every new service adds metrics. Every new deployment adds trace data. Every new integration adds logs. The data volumes compound year over year, and with most observability pricing models tied directly to data ingestion, the bill compounds with them.
The conversation that is happening now — in engineering all-hands meetings, in budget reviews, in renewal negotiations — is whether the observability bill is growing faster than the observability value. For many teams, the honest answer is yes.
This post is about how to break that pattern without losing the visibility your team depends on.
Why Observability Bills Keep Growing
Understanding why the bill grows is the first step toward controlling it.
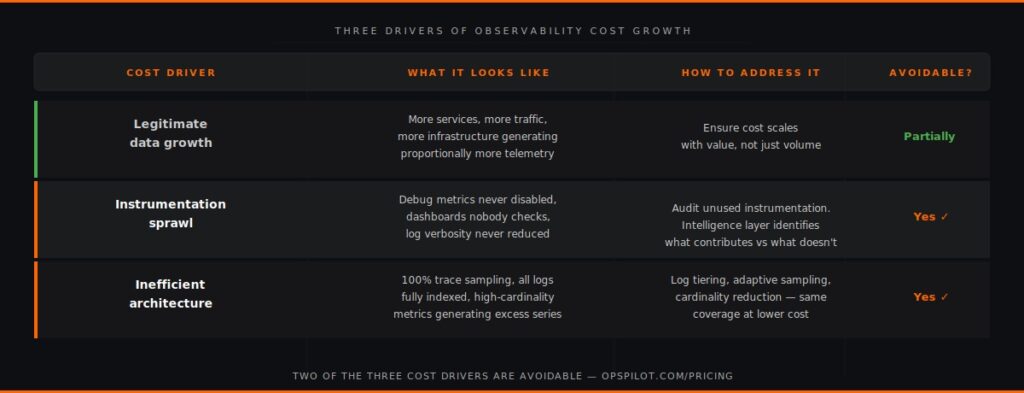
Observability cost growth has three distinct drivers, and most teams conflate them when they should be addressing them separately.
Driver 1: Legitimate data growth
As systems grow — more services, more traffic, more infrastructure — telemetry volume grows with them. This is real, unavoidable, and not inherently a problem. A system handling ten times the traffic should be generating more observability data. The cost increase associated with legitimate growth is a sign of success, not waste.
The problem is when legitimate data growth is treated as the only driver. Teams accept every cost increase as inevitable because systems are growing, without examining how much of the growth is legitimate and how much is something else.
Driver 2: Instrumentation sprawl
Over time, observability instrumentation accumulates. Dashboards get built and never removed. Metrics get added for debugging and never disabled. Trace sampling rates get increased during an incident and never reduced. Log verbosity gets turned up temporarily and stays up.
This is instrumentation sprawl — telemetry being collected that was once useful and is no longer needed, or that was never as useful as assumed. It adds cost without adding value.
Most teams have significant instrumentation sprawl but have no systematic way of identifying it. The data is flowing, the bill is being paid, and nobody is looking at whether each category of telemetry is earning its cost.
Driver 3: Inefficient architecture
Some observability cost growth comes from architectural choices that made sense at the time but haven’t been revisited. Sending every log line to an expensive backend when only error logs need full indexing. Running high-frequency metric collection on services that don’t change rapidly. Storing trace data at full resolution for services where sampled data would be sufficient.
These are not instrumentation sprawl — the data is still useful. But the cost of retaining it at the current level of fidelity is higher than the value it delivers.
The Observability Cost Reduction Conversation Most Teams Don’t Have
When engineering teams face observability budget pressure, the typical response is one of two things: accept the increase and defend it in the next budget review, or cut back on instrumentation and accept reduced visibility.
Neither is the right response. Both treat observability as a binary — either pay whatever it costs to maintain current coverage, or reduce coverage to save money.
The right conversation is about value density: how much operational value is being generated per dollar of observability spend.
A team spending $15,000 per month on observability and getting reactive incident response from it has low value density. The same team spending $15,000 per month and getting proactive pattern detection, automated cost optimisation, continuous gap analysis, and measurable health improvement has high value density.
The observability cost reduction opportunity is not just about spending less. It is about getting more from what you’re already spending — and then, having established higher value density, identifying where spending can be reduced without reducing value. OpsPilot’s proactive AI capability is specifically designed to deliver that value density — continuous analysis that makes every dollar of observability spend work harder.
As we covered in OpenTelemetry Without Intelligence Is Just Expensive Data Collection, most teams are operating at a fraction of their observability data’s potential value. The data is there. The intelligence layer that extracts full value from it typically isn’t.
Already questioning your observability spend? See how OpsPilot compares to your current stack — no form, no sales call. opspilot.com/pricing
Three Ways To Break The Growth Pattern
Observability cost reduction that doesn’t compromise visibility requires addressing all three cost drivers — not just cutting instrumentation across the board.
Approach 1: Identify and eliminate instrumentation sprawl
The first step is a systematic audit of what telemetry is being collected, what it costs, and what value it delivers.
Most teams discover that a significant portion of their telemetry spend falls into one of these categories:
- Metrics collected for a specific debugging exercise that were never disabled
- Dashboards that nobody has opened in six months, still being populated with data
- Log verbosity set to DEBUG in a production service from a deployment six months ago
- Trace sampling at 100% for a high-volume service where 10% sampling would provide equivalent analytical value
None of this requires reducing coverage on services that matter. It requires visibility into which telemetry is being used and which isn’t — and the discipline to remove what isn’t earning its cost.
The challenge is that this audit is time-consuming to do manually. An intelligence layer that tracks which data sources contribute to recommendations and which don’t provides this visibility automatically. Instrumentation that never contributes to a pattern match or a recommendation is a candidate for reduction.
Approach 2: Optimize architecture before reducing coverage
Before cutting any instrumentation, examine whether the cost of retaining it at current fidelity is justified by its analytical value.
Practical optimizations that most teams haven’t made:
Log tiering — sending error and warning logs to full indexing, routing info and debug logs to cold storage or dropping them entirely for low-value services. The cost difference between indexed and archived log storage is typically an order of magnitude.
Adaptive trace sampling — running higher sampling rates for user-facing critical paths and lower rates for internal services and background jobs. A 10% sample of a high-volume internal service provides statistically equivalent analytical value at 10% of the cost.
Metric cardinality reduction — high-cardinality metrics (user IDs, session IDs, or request IDs as label dimensions) generate enormous volumes of time series data, most of which is never queried. Identifying and reducing high-cardinality labels is one of the highest-ROI observability cost optimizations available.
Approach 3: Use intelligence to find the waste in your existing bill
Beyond structural optimization, there is a category of observability cost reduction that requires looking not at your telemetry pipeline but at what your telemetry is revealing about your infrastructure.
Cloud cost waste — over-provisioned resources, unused allocations, idle services — shows up directly in your metrics data. OpsPilot’s cost optimization analysis continuously scans resource utilization metrics and surfaces specific recommendations: remove provisioned concurrency from these Lambda functions, resize these pods, consolidate these underutilized services.
For most teams, the savings from this kind of continuous cost signal analysis more than offset the cost of the intelligence layer itself. A single recommendation identifying $2,000 per month in unnecessary cloud spend pays for months of OpsPilot subscription.
This is the pattern break that makes observability cost reduction sustainable: the intelligence layer that helps you manage observability cost also generates the infrastructure cost savings that fund its own existence.
The Renewal Window Opportunity
For teams approaching renewal with Datadog, Dynatrace, or New Relic, the observability cost conversation has a natural forcing function: the renewal negotiation.
Renewals are typically the only realistic opportunity to renegotiate the architecture of your observability spend. During active subscription periods, switching costs are high and internal momentum favors the status quo. At renewal, the calculation is different — the disruption cost of switching is weighed against the ongoing cost of staying.
As we explored in In 2026 Your Observability Stack Should Tell You What To Fix Next, the question at renewal is not just “can we get a better price?” It’s “are we getting the right value from the right architecture?”
The teams that approach renewal having already evaluated alternatives — with a clear picture of what their current stack delivers versus what an alternative would deliver — have the strongest negotiating position. Those who approach renewal without that preparation typically accept the renewal terms with a modest discount.
The time to evaluate alternatives is three to six months before renewal, not at renewal. That window allows for a genuine trial, a realistic migration assessment, and a considered decision rather than a time-pressured one.
What Observability Cost Reduction Actually Looks Like
A team that addresses all three cost drivers — instrumentation sprawl, architectural inefficiency, and intelligence-driven infrastructure savings — typically sees:
Reduced telemetry pipeline cost from eliminating unused instrumentation and optimizing log and trace retention architecture. This varies widely by team but 20-40% reduction in raw telemetry cost is achievable without any reduction in analytical coverage.
Reduced cloud infrastructure cost from continuous cost signal analysis identifying waste in the metrics data. For most teams with 20+ services, this is a five-figure annual saving surfaced within the first month of running intelligent analysis.
Reduced engineering time cost from moving away from manual dashboard review and reactive incident response. The time saving from proactive pattern detection and automated root cause correlation is the largest component of observability ROI — but also the hardest to quantify without a baseline measurement. OpsPilot’s health scoring and recommendation tracking provides that baseline.
Better budget justification for what remains. An observability stack that generates measurable cost savings and traceable operational improvements is easier to defend in budget reviews than one that generates dashboards and alerts. The shift from cost center to value driver changes the conversation with leadership.
The Benchmark Question
Here is the question worth asking about your current observability spend:
For every dollar you spend on observability tooling, how much operational value — in reduced incident frequency, reduced root cause time, reduced cloud waste, reduced on-call burden — can you point to?
If the answer is “roughly the same as it was when we were spending half as much,” the growth in spend has outpaced the growth in value. That is the pattern worth breaking.
Observability cost reduction is not about spending less on visibility. It is about spending more efficiently on outcomes. The teams that get this right in 2026 will enter 2027 renewals from a position of strength rather than price pressure.
You can see how OpsPilot compares to your current observability spend at opspilot.com/pricing — no form, no sales call.
FAQ
Is it possible to reduce observability cost without reducing visibility? Yes, for most teams. The majority of observability cost growth comes from instrumentation sprawl and architectural inefficiency rather than from genuinely necessary data collection. Systematic identification of unused instrumentation, log tiering, adaptive trace sampling, and metric cardinality reduction typically reduce cost significantly without reducing analytical coverage on the services that matter.
How does OpsPilot help with observability cost reduction specifically? In two ways. First, OpsPilot’s gap detection identifies which instrumentation is contributing to analysis and which isn’t — providing the visibility needed to make informed decisions about what to retain and what to reduce. Second, OpsPilot’s cost optimization analysis continuously scans resource utilization metrics and surfaces infrastructure waste that can be eliminated. For most teams, the infrastructure savings surfaced by the second capability more than offset the cost of the platform.
What is metric cardinality and why does it matter for cost? Metric cardinality refers to the number of unique time series generated by a metric. A metric with high-cardinality labels — such as a label that contains a user ID or a request ID — generates a new time series for every unique value, which can mean millions of time series from a single metric. Most observability backends charge based on the number of active time series, so high-cardinality metrics are a disproportionate driver of cost. Identifying and reducing them is one of the highest-ROI cost optimizations available.
How far in advance of renewal should we start evaluating alternatives? Three to six months is the right window. Earlier than three months, it’s hard to run a genuine trial and gather meaningful comparison data. Later than six weeks, time pressure starts to affect decision quality. Starting evaluation at three to six months gives the team time to run OpsPilot alongside the existing stack, measure the comparative value, and make a considered decision with time to negotiate properly.

See how your current observability spend compares — no form, no sales call.
Or start seeing what your data can tell you right now: Start your free trial at app.opspilot.com/sign-up
OpsPilot is an AI-powered observability intelligence platform that continuously analyzes your OpenTelemetry data and delivers prioritized recommendations, health scoring, and gap detection — directly to your team. Built by APM engineers with two decades of experience.