
Observability Platform Budget 2026: How To Defend Your Spend When Leadership Asks Hard Questions"
The observability platform budget conversation has changed.
Two years ago, engineering leaders could justify observability spend with a simple argument: we need to know when things break. The business accepted this. Monitoring was infrastructure, infrastructure had cost, and the cost was absorbed without much scrutiny.
In 2026, that conversation is harder. Observability spend has grown — significantly, for most organizations. The combination of telemetry volume growth, tool proliferation, and the addition of AI-layer products has pushed observability from a modest line item to a material budget category. Leadership has noticed. The questions are getting more specific.
“What are we getting for this?” “Can we reduce it?” “Is there a cheaper alternative?” “What would happen if we cut it by 30%?”
These are reasonable questions. They deserve better answers than “we need it to keep the lights on.” This post is about how to build those answers — and how an AI site reliability engineering (AI SRE) platform changes the budget conversation from defensive to proactive.
Why Your Observability Platform Budget Needs Better Answers
The problem with defending observability spend on reliability grounds alone is that reliability is invisible when it’s working. Leadership sees the cost every month. They see outages when they happen. They rarely see the incidents that didn’t happen — the connection pool that was trending toward exhaustion, caught and resolved before it fired; the memory growth pattern addressed during business hours rather than at 2am.
Invisible value is hard to defend in a budget review. The engineering team knows the observability stack is preventing incidents. Finance sees a cost that grows with the system and produces no visible output unless something goes wrong.
This is not a communication problem. It is a measurement problem. The teams that defend observability budgets successfully are the ones that can quantify what their observability investment is producing — not in terms of “we’re monitoring 47 services” but in terms that leadership understands: incidents prevented, engineer time saved, cloud cost reduced, MTTR improved.
As we covered in Telemetry Volume Goes Up Every Year. So Does Your Bill., the growth in observability spend often outpaces the growth in observability value. That gap is exactly what leadership is sensing — and exactly what needs to be addressed.
The Three Questions Leadership Is Actually Asking
When a CFO or VP asks “can we reduce observability spend?”, they are usually asking one of three underlying questions. Getting clear on which one matters for how you respond.
Question 1: Is this spend efficient?
Are we getting full value from what we’re paying? This is the most common form of the question, and it is entirely reasonable. Organizations that have accumulated observability tooling over several years — multiple APM tools, a metrics platform, a log management solution, separate alerting — often have significant redundancy. Leadership senses this even if they can’t articulate it.
The right response to this question is an audit. Where is the spend going? What is each tool delivering? Where is there overlap? As we explored in What Is An Observability Platform?, many teams have strong collection and visualization layers but are missing the intelligence layer entirely — meaning they are paying for data they are not fully exploiting.
Question 2: Is this the right tool?
Could we get the same capability for less? This is the renewal window question, and it is most acute in the 3-6 months before a Datadog, Dynatrace, or New Relic contract renewal. The CPC data for “datadog alternative” searches (€54.90 per click) tells you that a significant number of organizations are actively researching this question — and that vendors are spending heavily to intercept them.
The right response is a structured evaluation. What does the current tool deliver? What would a modern alternative deliver? What is the realistic cost of switching versus the ongoing cost of staying? The true cost comparison at opspilot.com/pricing/ addresses this directly — no form, no sales call.
Question 3: What happens if we cut it?
This is the most dangerous question because it often gets asked by someone who has already decided the answer is “not much.” The right response requires being able to quantify what the observability stack is preventing, not just what it is currently doing.
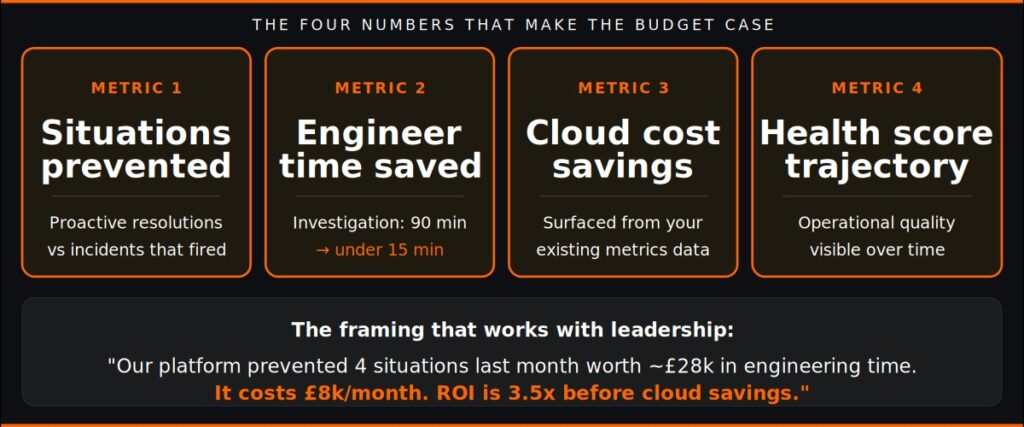
A defensible observability budget is built on four measurable outputs. If you can quantify all four, you can walk into any budget review with a positive ROI case.
1. Incidents prevented
This requires a baseline. How many significant incidents did the team respond to per month before the current observability setup? How many are being responded to now? The difference, multiplied by the average cost of an incident (engineering time, customer impact, revenue loss where applicable), is the most direct ROI metric available.
With an AI SRE intelligence layer like OpsPilot’s Coworker, this number becomes trackable in a way it previously wasn’t. Coworker surfaces situations — grouped findings that represent real operational problems — and tracks when those situations are resolved proactively versus when they escalate to incidents. The ratio of proactive resolutions to reactive incidents is a metric leadership can understand.
2. Engineer time saved
How much engineer time is currently going to incident investigation, alert triage, and dashboard review? This is typically 40-50% of SRE time in organizations without an AI SRE layer. Multiplied by the engineering cost per hour and the team size, this produces a concrete cost figure that can be directly compared to the observability platform cost.
Coworker’s background investigation work — pulling relevant metrics, logs, and traces when a signal fires, writing up what it finds as insights, grouping them into situations — is the automated equivalent of the orientation phase of incident investigation. Teams that have measured this consistently report the investigation phase dropping from 60-90 minutes to under 15. The engineer time saving is real and quantifiable.
3. Cloud cost optimizations surfaced
Your OpenTelemetry metrics include resource utilization data. Coworker scans this continuously and surfaces specific cost optimization situations — over-provisioned resources, idle allocations, inefficient configurations — as part of its normal operation. These findings are concrete and immediate: “reduce provisioned concurrency on these Lambda functions, estimated saving $1,800/month.”
For most organizations, the infrastructure cost savings surfaced by the intelligence layer in the first month exceed the cost of the platform itself. This is the ROI argument that resonates most clearly with finance: the tool pays for itself.
4. Health score trajectory
OpsPilot’s health scoring tracks operational quality across multiple dimensions — performance, error rate management, cost efficiency, alerting quality, instrumentation coverage — and produces a score that changes over time. A health score that moves from 68 to 81 over a quarter is a visible indicator of operational improvement that previously had no representation in any report.
This is the metric that turns observability from invisible infrastructure into demonstrated progress. Leadership can see the trend. They can connect the investment to the improvement. The budget conversation shifts from “why does this cost so much?” to “what would happen to this score if we reduced the investment?”
How to Structure the Conversation
The framing that works best with leadership is cost-to-outcome, not cost-to-feature.
Don’t say: “We need Datadog because it monitors our 47 services across three cloud regions with 15-second metric resolution and distributed tracing.”
Do say: “Our observability platform prevented 4 incidents last month that historically would have averaged 3 hours each to resolve. At our engineering cost, that’s approximately £28,000 of engineering time saved. The platform costs £8,000 per month. The ROI is 3.5x before we count the cloud cost savings it surfaced.”
The second framing is a business argument. It uses the language leadership uses. It produces a number they can compare against other investments.
To make this argument credible, you need the measurement infrastructure in place, which is itself an argument for an AI SRE platform that tracks these metrics automatically rather than requiring engineers to compile them manually.
The Renewal Window: Your Observability Platform Budget Reset
If your organization is approaching renewal with an existing observability vendor, that window is the natural moment to reset the budget conversation — not to negotiate a discount, but to re-evaluate the architecture of your observability spend.
As we covered in AIOps in 2026, the teams that approach renewal with a genuine alternative evaluation — with data on what each platform actually delivers — negotiate from strength. Those that approach without preparation accept whatever terms they’re offered.
The questions worth answering before renewal:
- Does the current platform include an intelligence layer, or just collection and visualization?
- Can we quantify what the platform prevented last quarter, not just what it monitored?
- What would a modern AI SRE alternative deliver at what cost?
- What is the realistic switching cost, and how does it compare to the savings available?
OpsPilot’s comparison with existing platforms addresses this directly. The pricing page includes a live cost comparison calculator. No form, no sales call.
The AI SRE Advantage in the Budget Conversation
The traditional observability budget argument is defensive: we need this to maintain current reliability. The AI SRE budget argument is different: this platform generates measurable returns that exceed its cost.
That shift — from “necessary cost” to “positive investment” — is the fundamental change that AI SRE makes to the budget conversation. When Coworker’s situations surface a cloud cost saving that pays for three months of the platform, when its proactive detection prevents two incidents that would have each cost six engineer-hours, when its health scoring shows leadership that operational quality has improved 19 points in a quarter — the conversation moves from defense to evidence.
The engineering leader who can walk into a budget review with those numbers is not defending a cost. They are presenting a return.
See the AI SRE capability page for more on how Coworker builds the operational measurement framework that makes this case possible.
FAQ
What’s the fastest way to build a ROI case for observability spend? Start with engineer time. Calculate how many hours per month go to incident investigation, alert triage, and dashboard review. Multiply by your fully-loaded engineering hourly cost. That number, compared to your observability platform cost, is the baseline ROI argument. Add cloud cost savings surfaced by the intelligence layer and incidents prevented for a complete picture.
How do I quantify incidents prevented if we don’t have a baseline? OpsPilot’s Coworker tracks situations — grouped findings that represent real operational problems — and distinguishes between those resolved proactively and those that escalated to incidents. Running Coworker for 30 days alongside your existing tooling gives you the baseline data you need to make the prevention argument credibly.
What if leadership just wants a lower number? The most effective response is to offer a structured reduction rather than a blanket cut. Identify which elements of current observability spend are generating clear value and which are not. Instrumentation sprawl — debug metrics never disabled, dashboards nobody checks, redundant tooling — is typically where meaningful cost reduction is available without affecting operational coverage. As we covered in Telemetry Volume Goes Up Every Year, two of the three drivers of observability cost growth are avoidable.
Is OpsPilot SOC 2 compliant? Yes. OpsPilot is SOC 2 Type 2 accredited. Full details are available at /soc-2-type-2-accreditation/.
Turn your observability stack into a measurable business investment.
Book a demo → calendly.com/fusionreactor-sales/opspilot-demo
Or explore first: Start your free trial → app.opspilot.com/sign-up
OpsPilot is the AI SRE teammate for teams using OpenTelemetry, Prometheus, Grafana, and existing observability stacks — helping engineers investigate incidents, find root cause, and move toward autonomous operations without replacing their tools. OpsPilot, formerly FusionReactor Cloud, is Intergral’s AI-powered observability and AI SRE platform.