
AI SRE Tools and the MTTR Problem: Why You're Measuring the Wrong Thing
Mean time to recovery is a lagging indicator. It tells you how fast your team recovered from an incident that already happened. For teams adopting AI SRE tools, it is also the wrong primary metric — because the most significant impact of AI SRE tools is not faster recovery. It is fewer incidents requiring recovery.
This distinction matters for how engineering leaders evaluate and present the value of AI SRE tools. A team that adopts OpsPilot’s Coworker and measures success by MTTR improvement will find meaningful improvement — investigation time drops significantly when Coworker pre-assembles the context. But MTTR-only measurement misses the more significant value: the incidents that Coworker’s proactive pattern detection prevented entirely.
An incident that doesn’t happen has zero MTTR contribution. It also has zero user impact, zero on-call interruption, zero post-incident review cost, and zero addition to engineer cognitive load. The value is real. It is invisible to MTTR.
This post is about why site reliability engineering (SRE) teams using AI SRE tools need a different measurement framework — one that captures the full value of proactive operations rather than just the efficiency gains on the reactive operations that remain.
Why MTTR Persists as the Primary Metric
MTTR has legitimate virtues as a reliability metric. It is easy to calculate from incident management data. It is comparable across teams and over time. It correlates with user impact — shorter incidents mean less user-facing degradation. It provides a clear target for improvement.
The problem is that MTTR optimisation leads to different interventions than AI SRE tools. If MTTR is your primary metric, you optimise for faster detection, faster escalation, better runbooks, and faster remediation. These are all worth pursuing. They leave the fundamental architecture unchanged: reactive monitoring, threshold alerts, manual investigation, human remediation.
AI SRE tools address a different problem. They reduce the number of incidents that require MTTR measurement at all. A team that moves from 12 significant incidents per month to 4 — because Coworker catches the other 8 as situations during business hours and they are resolved before escalating — has dramatically better reliability outcomes. Their MTTR on the 4 remaining incidents may also improve, but that is a secondary effect. The primary effect is an 8-incident reduction that MTTR alone does not capture.
This is not a theoretical distinction. For teams evaluating AI SRE tools, presenting only MTTR improvement to leadership undervalues the investment and creates a misleading picture of what the tools actually change.
The Four Metrics That Capture What AI SRE Tools Actually Do
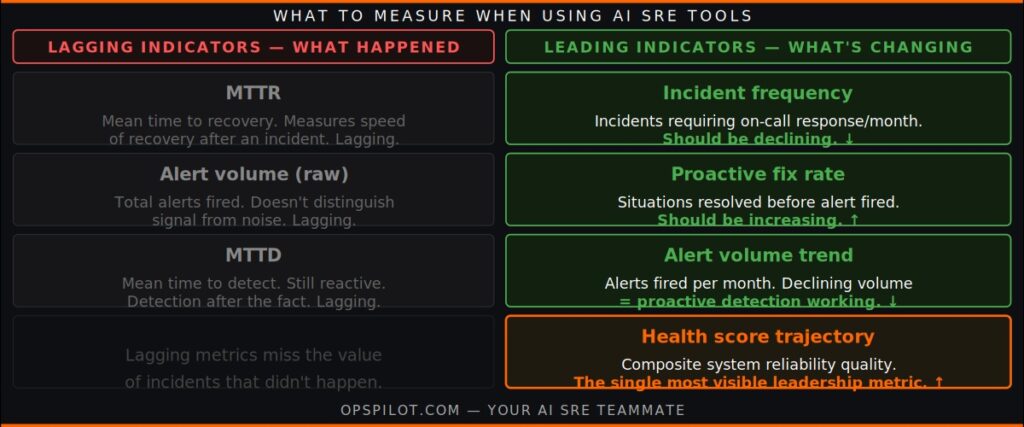
A measurement framework for AI SRE tools needs to capture both reactive improvements (MTTR reduction) and proactive impacts (incident prevention). Four metrics together provide a complete picture.
1. Incident frequency — the primary leading indicator
Incident frequency — how many incidents require reactive response per month — is the metric that most directly reflects whether AI SRE tools are working. A proactive AI SRE platform that catches patterns before they escalate reduces incident frequency. MTTR can remain flat or even increase (because the incidents that remain are the genuinely novel ones that are harder to resolve) while incident frequency falls significantly.
Measure: significant incidents per month requiring on-call response. Track trend over three months. A well-functioning AI SRE deployment should show declining frequency within the first 60 days.
2. Proactive fix rate — what didn’t become an incident
Proactive fix rate is the metric that captures the value MTTR cannot: the situations Coworker surfaced and your team resolved before they became incidents. If Coworker surfaces 15 situations in a month and 10 of them are resolved proactively during business hours, your proactive fix rate is 67%.
This metric requires a situation tracking system — which Coworker provides natively. It is the most direct measure of whether the AI SRE intelligence layer is adding value above and beyond faster incident response.
Measure: situations resolved proactively (no alert fired) as a percentage of all situations surfaced. Track trend monthly.
3. Alert volume — the noise signal
Alert volume — the number of alerts that fire and require engineer evaluation per month — measures the quality of the monitoring architecture rather than the speed of response. High alert volume indicates that most reliability management is reactive. Declining alert volume, in the context of stable or declining incident frequency, indicates that proactive detection is working.
Alert volume reduction is often the first improvement teams notice after deploying AI SRE tools, typically within the first four weeks. Coworker’s proactive pattern detection catches the situations that would have generated alerts, resolves them, and the alerts never fire.
Measure: alert volume per month, broken down by severity. Track trend from deployment baseline.
4. Health score trajectory — the system-level view
Coworker’s health score provides a composite view of production system reliability quality — synthesizing patterns from metrics, logs, and traces into a single directional indicator. A health score that trends from 64 to 79 over a quarter represents genuine improvement in the underlying reliability posture of the production system, regardless of what individual MTTR figures show for the incidents that occurred during that period.
Health score trajectory is particularly useful for leadership conversations because it provides a single visible trend rather than a set of incident-specific data points. It answers the question “is the system getting more reliable?” rather than “how fast did we recover from the last incident?”
Measure: Coworker health score, tracked weekly. Month-over-month and quarter-over-quarter trend.
Presenting AI SRE Tool Value to Leadership
The MTTR problem is partly a communication problem. Engineering leaders who present AI SRE tool value using only MTTR data are understating the case. The complete picture requires all four metrics above, framed as a before-and-after comparison.
A complete AI SRE tool value presentation includes:
Before: incident frequency X/month, alert volume Y/month, average investigation time Z minutes, health score N.
After 90 days: incident frequency reduced to X’, alert volume reduced to Y’, average investigation time reduced to Z’, health score improved to N’.
Incidents prevented: (X – X’) incidents per month that would have required engineer response, on-call interruption, and user impact. Quantified at an engineering time cost per incident.
Cost comparison: total engineering cost reduction vs platform cost, showing net positive ROI even before counting user impact improvement and retention benefit.
As we covered in AI Incident Investigation, the fully-loaded cost of each incident includes direct investigation time, alert overhead, and cognitive productivity impact. When incident frequency falls by 8 incidents per month, those costs fall with it.
For more on the leadership framing of AI SRE value, see Operational Resilience 2026 and the OpsPilot pricing page — no form, no sales call.
Ready to see all four metrics move on your stack? Start your free trial at app.opspilot.com/sign-up — no credit card required.
Getting the Baseline Right
The four-metric framework only works if you have a baseline. Teams evaluating AI SRE tools should capture their current state before deployment:
Incident frequency baseline: pull the last 90 days of incidents from your incident management system. How many required on-call responses? What is the trend — stable, increasing, or decreasing?
Alert volume baseline: pull the last 30 days of alert volume from your alerting system. How many alerts fired? What percentage resulted in genuine incidents?
Investigation time baseline: from incident records, what is the average and p90 time from alert to root cause identification? This is separate from total incident duration.
Health score baseline: Coworker establishes this automatically during the first analysis cycle. You will see a baseline health score within the first 24-48 hours.
With these four baselines established, the value of AI SRE tools becomes measurable and specific rather than qualitative and approximate. The 90-day comparison is the point at which baselines have matured enough to provide meaningful signal.
As we covered in How to Evaluate an AI SRE Platform, evaluating AI SRE tools at day one is like evaluating a new engineer on their first week. The 90-day picture is where the full value is visible.
For more on what to look for during evaluation, see the AI SRE capability page and the proactive AI page.
Frequently Asked Questions
Not irrelevant, but secondary. MTTR remains useful for measuring improvement in how your team handles the incidents that do occur. A declining MTTR alongside declining incident frequency indicates both proactive prevention and reactive improvement. A flat or rising MTTR alongside falling incident frequency is also a positive outcome if the remaining incidents are the harder novel failures — it means the preventable incidents have been eliminated, leaving only the genuinely difficult ones.
Coworker surfaces situations in Slack with severity and status fields. The situations that move from active to resolved without a corresponding alert firing are your proactive fixes. Most teams start tracking this naturally within the first few weeks of Coworker deployment as they review the situation feed. OpsPilot's dashboard provides situation history that makes this calculation straightforward.
Benchmarks vary significantly by team size, service count, and system complexity. What matters more than benchmarks is the direction of travel for your specific system. A health score improving from 58 to 74 is meaningful regardless of what other teams score. Focus on your own baseline trend rather than cross-team comparison.
Alert volume improvement typically appears within the first four weeks. Incident frequency improvement typically becomes visible over 60-90 days as baselines mature. Investigation time improvement is visible almost immediately — the first incidents where Coworker provides investigation context show the effect directly. Health score trajectory becomes meaningful over a 60-90 day period.

Measure what AI SRE tools actually change. Start with a baseline today.
Start your free trial → app.opspilot.com/sign-up
Or talk it through: Book a demo → calendly.com/fusionreactor-sales/opspilot-demo
OpsPilot is the AI SRE teammate for teams using OpenTelemetry, Prometheus, Grafana, and existing observability stacks — helping engineers investigate incidents, find root cause, and move toward autonomous operations without replacing their tools. OpsPilot, formerly FusionReactor Cloud, is Intergral’s AI-powered observability and AI SRE platform.