
What Good Observability Platform Coverage Actually Looks Like — And How to Know If You Have It
Most engineering teams assume their observability platform coverage is reasonably complete. They have metrics from Prometheus, logs from Loki, traces from Tempo or Jaeger. The dashboards are populated. The alerts are configured. They can investigate incidents by querying across all three signal types.
What most teams don’t have is a systematic understanding of where their coverage actually ends — which services are instrumented, which aren’t, which have metrics but no traces, which have traces that break at service boundaries, which are generating structured logs and which are producing freeform text that can only be searched with regex.
The assumption of completeness is the problem. An observability platform with gaps in its coverage has blind spots — services that can fail without surfacing a signal, dependency chains that can degrade without a correlatable trace, log outputs that can contain the root cause of an incident but not be findable during investigation. These blind spots don’t announce themselves. They only become visible when an incident occurs in a part of the system that wasn’t being watched.
This post is about what genuinely complete observability platform coverage looks like in 2026, how to assess where your current coverage ends, and what an AI site reliability engineering (SRE) platform does to both identify gaps and make partial coverage more useful than it currently is.
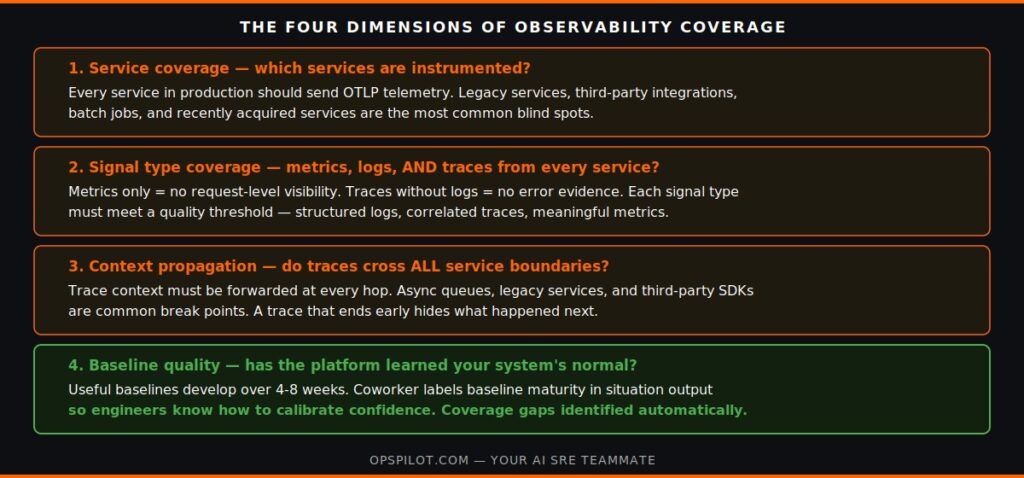
The Four Dimensions of Observability Coverage
Good observability platform coverage is not simply “metrics, logs, and traces from all services.” It has four dimensions, each of which can be complete or incomplete independently of the others.
Dimension 1: Service coverage
The most basic dimension: which of your production services are instrumented and sending telemetry? For most teams running OpenTelemetry, the answer is “most but not all.” Legacy services, third-party integrations, batch processing systems, and recently acquired services are the most common gaps.
Service coverage gaps are the most consequential blind spots. A service that generates no OTLP telemetry is completely invisible to your observability platform. When that service is involved in an incident — as a root cause, as a dependency, or as an affected component — it contributes nothing to the investigation.
The practical test: list every service in your production system. Cross-reference against your OTLP telemetry sources. Any service not on both lists is a coverage gap. Prioritize the gaps by incident likelihood — the services most likely to be involved in reliability events should be instrumented first.
Dimension 2: Signal type coverage
Service coverage is necessary but not sufficient. A service that produces metrics but no traces is partially covered — you can see aggregate performance metrics but you cannot follow a specific request across service boundaries or identify which operation within the service is the bottleneck. A service that produces metrics and traces but no structured logs is also partially covered — you can identify which service caused an incident and trace the request, but you cannot see the specific log evidence that explains what went wrong.
Complete signal type coverage means metrics, logs, and traces from every service — with each signal type implemented at a level that produces operationally useful data:
Metrics: key service-level indicators (request rate, error rate, latency) plus resource utilization (CPU, memory, connections). Custom business metrics where relevant.
Logs: structured JSON output with consistent field schemas, trace ID correlation, and verbosity calibrated to operational need rather than development convenience.
Traces: distributed traces with complete context propagation across all service boundaries, sampling rates appropriate to traffic volume, and structured span attributes that enable pattern analysis.
As we covered in Distributed Tracing 2026, trace coverage specifically tends to have hidden gaps — services where trace context propagation breaks between service boundaries, producing traces that appear complete but actually end before reaching the root cause.
Dimension 3: Context propagation completeness
Context propagation is what makes distributed tracing coherent. When a request enters your system and propagates through multiple services, the trace context — the trace ID and span ID — must be forwarded from each service to the next. If any service in the chain drops the trace context, the trace breaks at that point, producing an incomplete picture.
Broken trace propagation is the most common hidden gap in observability platform coverage. It is particularly common at:
- Async processing boundaries where messages are passed through a queue rather than a direct service call
- Services using SDKs or frameworks that don’t automatically propagate trace context
- Third-party integrations where context propagation is not supported
- Legacy services where instrumentation was added after the fact rather than designed in
The test for propagation completeness is straightforward: take a complete end-to-end user journey and follow the trace. If the trace ends before reaching a service that you know was involved in processing the request, you have a propagation gap.
Dimension 4: Baseline quality
The fourth dimension is the hardest to assess from the outside: are your baselines meaningful? An observability platform that has been running for three months on a specific production system has different baseline quality than one that was connected yesterday.
Meaningful baselines require enough historical data to distinguish normal from abnormal — to know that this service’s p95 latency is usually 45ms and today it is 180ms, rather than observing that the current value is 180ms without context. For most observability platforms, useful baselines develop over 4-8 weeks of stable operation.
Baseline quality is particularly relevant for AI SRE platforms, where the baselines directly determine detection accuracy. As we covered in OpenTelemetry Maturity, the jump from Stage 2 (unified OTLP) to Stage 3 (AI SRE active with meaningful detection) is partly a function of baseline maturity rather than just instrumentation completeness.
How to Assess Your Current Coverage
A practical coverage assessment has four steps, one for each dimension:
Step 1 — Service inventory audit. List every service, database, queue, and external dependency in your production system. Map each against your OTLP telemetry sources. Flag everything that appears in the system architecture but not in the telemetry inventory. This is your service coverage gap list.
Step 2 — Signal type matrix. For every instrumented service, confirm which of the three signal types it produces and at what quality level. A simple matrix: service name, metrics (yes/partial/no), logs (structured/unstructured/no), traces (yes/broken propagation/no). Partial and broken entries are as important to flag as missing entries.
Step 3 — Propagation trace test. Pick three representative user journeys — a successful request, an error case, and a slow request. Follow each as a trace. Note where each trace ends. If any trace ends before reaching a service you know was involved, you have a propagation gap at that boundary.
Step 4 — Baseline age check. How long has your current OTLP pipeline been connected to your observability platform? Baselines younger than four weeks should be treated as provisional. Detection accuracy will improve materially as baselines mature.
What Coworker Does for Coverage Assessment
One of the most practically useful capabilities OpsPilot’s Coworker provides is continuous coverage gap detection — identifying services that are present in your metrics but absent from your traces, log outputs that are present but unstructured, and trace propagation breaks at specific service boundaries.
This coverage gap detection is not a one-time audit. As your system evolves — new services deployed, existing services updated, traffic patterns changing — coverage gaps develop continuously. A service that was fully instrumented six months ago may have added a new dependency that is not instrumented. A deployment that introduced a new code path may have bypassed trace context propagation. Coworker identifies these gaps as situations, naming the specific service or boundary, so coverage improvement is a continuous prioritized queue rather than an occasional audit exercise.
The practical consequence is that the coverage assessment process described above — which is valuable to run once — becomes a continuous automated process rather than a periodic manual one.
For teams using Grafana as their visualization layer, coverage gap situations from Coworker appear alongside reliability situations in Slack. As we covered in Grafana AI SRE, Coworker’s coverage gap identification directly improves what both Grafana and Coworker can see.
For Kubernetes environments specifically, coverage gaps at the container and pod level are identified alongside application-level gaps. As we covered in Kubernetes Observability, four-layer coverage (node, pod, container, application) is the complete picture for K8s environments.
For the cost implications of coverage gaps, see Observability Cost. Teams often discover they are simultaneously paying for data they don’t need and missing data they do need.
See the OpenTelemetry page for instrumentation guidance. Start your free trial to see Coworker’s coverage gap situations for your specific stack — no credit card required.
Frequently Asked Questions
The practical test is to follow a real end-to-end user journey as a trace in your tracing tool. If the trace includes all the services you know the request passed through, propagation is complete for that path. If the trace ends before reaching a service that was involved, you have a propagation break at the boundary between the last visible service and the first invisible one. Coworker's gap detection identifies broken propagation boundaries automatically without requiring this manual test.
Coworker provides value proportional to coverage completeness — more complete coverage means more complete pattern detection. However, even partial coverage is useful: Coworker surfaces situations for instrumented services, identifies coverage gaps for uninstrumented ones, and provides a prioritized improvement roadmap. First situations appear within 24 hours of connection regardless of coverage completeness, and detection accuracy improves as coverage and baselines mature.
Useful baselines for typical variance detection develop within 2-4 weeks of continuous operation. Baselines that can reliably distinguish unusual weekly patterns from genuine anomalies typically require 6-8 weeks. Coworker labels baseline maturity explicitly in its situation output — situations generated against immature baselines are flagged appropriately so engineers can calibrate their confidence accordingly.
No. Starting the trial while coverage is incomplete gives you two things: the situations Coworker surfaces from your currently instrumented services (immediately useful), and a prioritized coverage gap list that shows which uninstrumented services matter most. Most teams find this a more efficient approach than completing a coverage project first — Coworker's gap detection tells you where to invest instrumentation effort based on operational relevance, not arbitrary completeness targets.
Find your coverage gaps. See what Coworker surfaces in 24 hours.
Start your free trial → app.opspilot.com/sign-up
Or talk it through: Book a demo → calendly.com/fusionreactor-sales/opspilot-demo
OpsPilot is the AI SRE teammate for teams using OpenTelemetry, Prometheus, Grafana, and existing observability stacks — helping engineers investigate incidents, find root cause, and move toward autonomous operations without replacing their tools. OpsPilot, formerly FusionReactor Cloud, is Intergral’s AI-powered observability and AI SRE platform.