
Observability Platform Metrics Your CTO Actually Cares About in 2026
Most observability platform metrics are built for engineers. P95 latency, cardinality counts, trace span depths, error budget burn rates — these are precise, operationally meaningful numbers that tell engineers exactly what is happening in a production system.
They are also largely meaningless to a CTO in a budget conversation.
The translation problem between engineering observability data and leadership visibility is one of the most common friction points in building the business case for observability platform investment. Engineering leaders have the data. They can show dashboards, incident timelines, and alert volumes. What they often can’t easily show is the answer to the question a CTO actually asks: is the reliability of our production system getting better, and what is that improvement worth?
This post is about the four metrics that answer that question — the observability platform outputs that translate directly into business outcomes visible at the leadership level, and how AI site reliability engineering (SRE) changes both what you can measure and how clearly you can present it.
Why Standard Observability Metrics Don’t Land With Leadership
The gap between engineering observability metrics and leadership visibility isn’t because CTOs don’t care about reliability. They care deeply. The gap is architectural — the metrics that observability platforms produce by default are optimized for engineering diagnosis, not for business outcome reporting.
MTTR measures how fast incidents are resolved. It’s a useful engineering metric. A CTO looking at MTTR can’t easily translate it into revenue impact, customer trust, or engineering capacity.
Error budget consumption tracks how much of an SLO’s tolerance has been used. Meaningful to engineers managing SLOs. Opaque to leadership who didn’t define the SLO and don’t have context for what 34% budget consumed means in business terms.
Alert volume shows how many alerts fired. High alert volume might mean a noisy monitoring setup or a genuinely unreliable system — the number alone doesn’t say which.
Cardinality and ingestion costs are pure engineering metrics — important for platform cost management, invisible as business outcomes.
As we covered in AI SRE Tools and the MTTR Problem, the shift from reactive to proactive SRE changes what the right metrics are. The same shift changes what leadership should be seeing from the observability platform.
The Four Metrics That Translate to the CTO Level
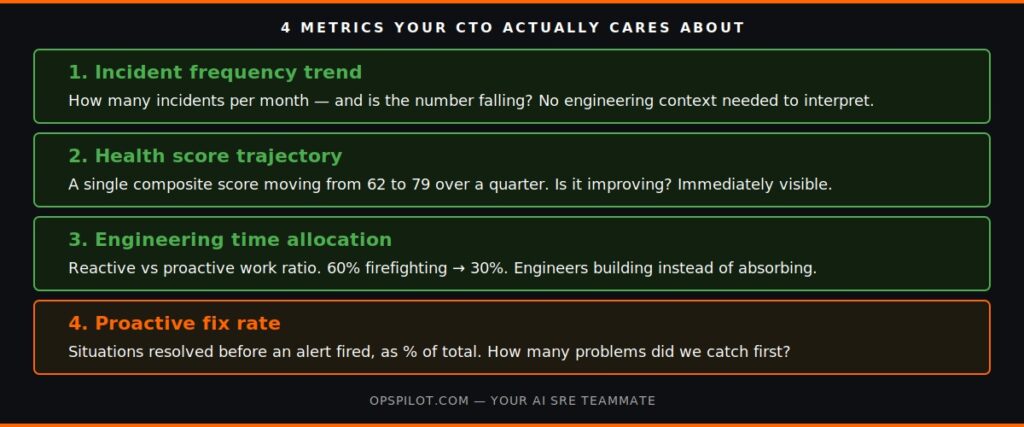
These four metrics don’t replace engineering observability data. They sit above it — the business-visible outputs that engineering observability and AI SRE produce when the stack is working correctly.
1. Incident frequency trend
Incident frequency — how many production incidents requiring engineer response occur per month — is the single most business-legible reliability metric. It requires no context about SLOs, cardinality, or trace sampling to interpret. Fewer incidents means more reliable software. The trend line tells leadership whether reliability is improving.
For a CTO conversation, incident frequency trend answers: “Is our engineering investment in reliability producing a measurably more reliable system over time?”
With a proactive AI SRE platform, incident frequency typically declines meaningfully within the first 60-90 days as proactive pattern detection begins catching situations before they escalate. A chart showing 14 incidents/month declining to 5 over a quarter is immediately legible to a CTO without engineering context.
2. Health score trajectory
OpsPilot’s Coworker produces a health score — a composite reliability quality indicator synthesized from patterns across metrics, logs, and traces. The health score changes over time as the underlying reliability posture of the production system improves or degrades.
Health score trajectory is the closest thing observability platforms have to a single-number answer to “how reliable is our system right now?” It aggregates engineering signals into a directional indicator that leadership can track without understanding the underlying telemetry.
A health score moving from 62 to 79 over a quarter answers: “Are we making progress?” in a way that a collection of individual dashboards cannot. It is the metric that makes reliability investment visible at the board level.
3. Engineering time allocation
The ratio of reactive engineering time (alert triage, incident investigation, war rooms) to proactive engineering time (reliability improvements, instrumentation quality, architectural work) is a direct measure of how effectively the observability platform is serving its intended purpose.
Most engineering leaders can estimate this ratio intuitively — “we spend about 60% of on-call capacity on reactive work.” Few track it explicitly. Presenting this ratio to leadership, and showing how it shifts as AI SRE proactive detection matures, makes the operational efficiency case in terms CTOs recognize: are our engineers spending their time on work that builds value, or absorbing failures reactively?
As we covered in SRE Burnout, the reactive/proactive ratio also has direct implications for retention — which has an immediate business cost that leadership understands.
4. Proactive fix rate
Proactive fix rate is the metric that captures what no traditional observability platform can show: the problems that were caught and resolved before they became incidents. Coworker surfaces this natively — situations resolved during business hours without an alert firing, as a percentage of all situations surfaced.
A proactive fix rate of 67% tells a CTO that two thirds of production problems were caught by the AI SRE layer before they required reactive response. It is the most direct measure of whether the observability platform is shifting operations from reactive to proactive — and it is a number that requires no engineering context to interpret.
For a team moving from 0% proactive fix rate (all incidents reactive, all investigation manual) to 60%+ over a quarter, the proactive fix rate trend is the most compelling single-metric demonstration that the AI SRE investment is working as intended.
For the pricing comparison, see the pricing page — no form, no sales call.
Ready to surface these metrics for your CTO conversation? Book a demo at calendly.com/fusionreactor-sales/opspilot-demo
Presenting the Business Case for Observability Platform Investment
The four metrics above form the structure of a CTO-level observability platform business case. The presentation sequence that works:
Start with the current state cost. Incident frequency × engineering time cost per incident × number of incidents per month = the monthly cost of reactive SRE operations. For most teams this is a number in the thousands of pounds per month that leadership has not seen explicitly.
Show the trajectory. 90 days of incident frequency trend and health score movement demonstrate that the observability platform investment is producing measurable improvement. This shifts the conversation from “are we spending money on monitoring tools?” to “can we see the return on that investment?”
Frame the proactive/reactive ratio shift. Engineers moving from 60% reactive to 30% reactive don’t just resolve incidents faster — they have capacity for reliability improvement work that compounds. The observability platform that makes this shift possible has strategic value beyond incident cost reduction.
Show the proactive fix rate. A proactive fix rate climbing from 0% to 60%+ over a quarter is the clearest demonstration that the AI SRE investment is working — not because incidents resolved faster, but because two thirds of them never became incidents at all.
For the full framework on making this case to leadership, see Operational Resilience 2026.
The AI SRE page covers how OpsPilot’s Coworker produces these metrics natively — health score, proactive fix rate, and situation history are all available in the dashboard without additional configuration.
Frequently Asked Questions
Present both, but lead with the four. MTTR has the advantage of being familiar — most CTOs have seen it before and understand that lower is better. The four metrics above add dimensions that MTTR misses: whether incidents are being prevented (not just resolved faster), whether reliability is directionally improving, and whether the engineering investment is producing measurable ROI. Together they give a more complete picture than MTTR alone.
Coworker establishes a baseline health score within the first 24-48 hours of connection. You don't need weeks of data to start — the initial score provides a baseline, and the trajectory becomes meaningful over 60-90 days. Starting the trial before your budget conversation gives you a real trajectory to present rather than a projected one.
Low incident frequency is itself the outcome of good reliability investment. The business case in this scenario shifts to: maintaining low incident frequency requires continuous investment; without proactive AI SRE, reliability tends to degrade as systems grow and instrumentation drifts. Present the health score trajectory as the leading indicator — a declining health score predicts rising incident frequency before it appears in the incident log.
There is no universal benchmark — it depends on your system's stability and how mature Coworker's baselines are. In the first four weeks, a proactive fix rate of 20-40% is typical as baselines establish. By 90 days, teams with good OpenTelemetry coverage commonly see 50-70%. What matters more than the absolute number is the direction: a proactive fix rate climbing month over month is a direct measure that the AI SRE layer is maturing and catching more problems earlier.
Give your CTO a reliability metric they can actually use.
Book a demo → calendly.com/fusionreactor-sales/opspilot-demo
Or start today: Free trial → app.opspilot.com/sign-up
OpsPilot is the AI SRE teammate for teams using OpenTelemetry, Prometheus, Grafana, and existing observability stacks — helping engineers investigate incidents, find root cause, and move toward autonomous operations without replacing their tools. OpsPilot, formerly FusionReactor Cloud, is Intergral’s AI-powered observability and AI SRE platform.