
Prometheus is very good at storing and querying your metrics — and Prometheus AI SRE is what makes those metrics work for you proactively.
It is not designed to watch them for you.
This is an intentional architectural choice, not a limitation. Prometheus is a pull-based metrics system. It scrapes your endpoints on a configured interval, stores the time-series data, and makes it available for query via PromQL. It answers questions when asked. It does not ask questions of its own.
For teams running Prometheus as part of their observability stack — which describes the majority of modern engineering teams — this creates a specific and familiar gap. Your Prometheus metrics contain everything you need to detect problems before they escalate. Connection pool saturation trends. Memory growth curves. Latency percentile drift. Error rate progression. All of it is there, in the time-series data, available for query at any moment.
But Prometheus does not query itself. It waits. And Prometheus AI SRE is what closes that gap — a continuous intelligence layer that watches your Prometheus metrics and surfaces what matters before you need to write a PromQL query to find it.
This post covers what Prometheus AI SRE adds to your existing stack, how it connects, and what changes for your team when you add it. If you are already running Grafana alongside Prometheus, see also the companion post on Grafana AI SRE.
What Prometheus Does Well — And Where It Stops
Prometheus excels at three things: reliable metric collection via pull-based scraping, efficient time-series storage optimized for range queries, and a powerful query language in PromQL that makes complex metric analysis expressible and reproducible.
Its alerting layer — Alertmanager — adds threshold-based notification when metric values cross configured rules. This is genuinely useful. It is also reactive: Alertmanager fires when a condition has already been met, not when a condition is trending toward being met.
The gap is between the data Prometheus holds and the analytical work required to extract value from it. PromQL is powerful, but it requires someone to write the query. Alert rules are effective, but they require someone to configure the threshold. Neither capability watches your metrics autonomously and surfaces what matters unprompted.
This is the gap that Prometheus AI SRE closes. As we covered in What Is An Observability Platform?, Prometheus provides Layers 1 and 2 of the observability platform model — collection and visualization. The intelligence layer that continuously analyzes what the data contains is Layer 3. Prometheus was never designed to be Layer 3. Prometheus AI SRE adds it.
How Prometheus AI SRE Works
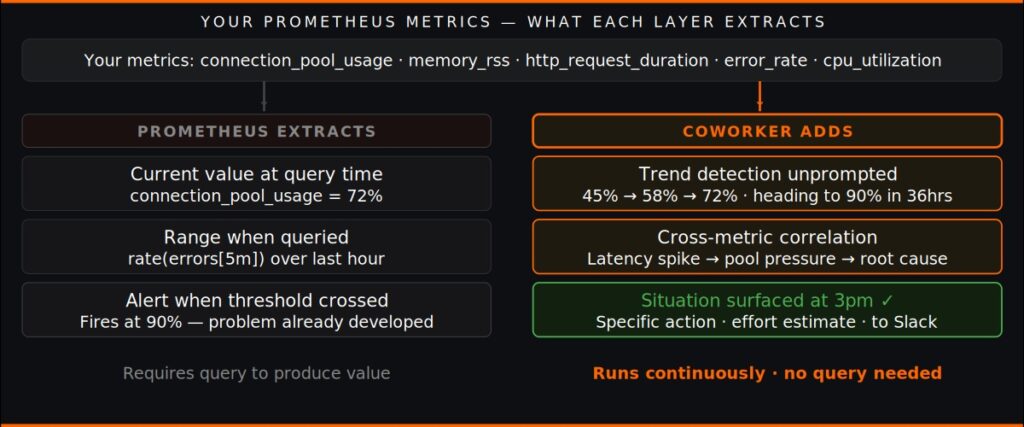
Adding Prometheus AI SRE with OpsPilot does not require changing your Prometheus setup. Your scrape jobs stay. Your recording rules stay. Your Alertmanager configuration and alert rules stay. Your Grafana dashboards querying Prometheus stay.
What you add is OpsPilot as an additional destination for your OTLP metrics data. If you are already using OpenTelemetry to instrument your services and exporting via OTLP, you add OpsPilot as a second exporter alongside your existing Prometheus remote write or Grafana Alloy pipeline. The same metrics stream reaches both your Prometheus backend and Coworker’s continuous analysis engine.
If you are running Prometheus with its native scraping rather than OpenTelemetry, you can route metrics to OpsPilot via the OpenTelemetry Collector’s Prometheus receiver — which scrapes your existing Prometheus endpoints and exports via OTLP. Your scrape jobs do not change. Your existing setup does not change.
The configuration is a single OTLP exporter. The setup takes minutes. The first situations arrive within the first 24-hour analysis cycle.
What Coworker Does With Your Prometheus Metrics
The specific value that Coworker extracts from your Prometheus metrics goes beyond what threshold-based Alertmanager rules can surface.
Trend detection before threshold crossing. Alertmanager fires when a value crosses a threshold. Coworker watches the trend. A connection pool at 70% is not alarming. A connection pool that was at 45% three days ago, at 58% yesterday, and at 70% today — trending at a rate that reaches exhaustion in 36 hours — is a pattern worth acting on now. Coworker detects the trend and surfaces a situation during business hours. Your engineer increases the pool size in 15 minutes. The 2am alert never fires.
Cross-metric correlation. Prometheus stores metrics from all your instrumented services. When a user-facing latency spike occurs, the root cause is often in a dependent service — a database query time that increased, a cache hit rate that dropped, a connection pool that is under pressure. Coworker correlates across your metric streams to identify the causal relationship. This is the correlation work that would take your engineer 60-90 minutes of PromQL queries to assemble manually.
Cost optimization from utilization data. Your Prometheus metrics include resource utilization data — CPU, memory, connection counts, request rates. Coworker scans this continuously for waste: over-provisioned resources running at low utilization, idle allocations, inefficient configurations that are visible in the metrics but require systematic review to find. Most teams running Prometheus have this cost signal in their data. Few have a systematic process for extracting it.
Alerting quality assessment. Coworker can identify alert rules that fire frequently but result in no action — noise that engineers are absorbing without value — and surface these as situations recommending rule adjustment. It can also identify services with incomplete metric coverage, where instrumentation gaps create analytical blind spots.
For the full list of AI SRE tools available for Prometheus-first teams, see the best AIOps tools for Prometheus 2026 guide.
Already running Prometheus? See what Coworker finds in your metrics. Start your free trial at app.opspilot.com/sign-up — no credit card required.
Lorem ipsum dolor sit amet, consectetur adipiscing elit. Ut elit tellus, luctus nec ullamcorper mattis, pulvinar dapibus leo.
Prometheus AI SRE and Your Existing Alert Rules
Keep your existing Alertmanager rules. Coworker operates upstream of your alerting layer, not as a replacement for it.
When Coworker detects a trend early and your team resolves it proactively, the Alertmanager rule that would have fired doesn’t fire. When alerts do fire — for novel failures or sudden degradations that don’t follow a visible trend — Coworker provides investigation context immediately, doing the cross-metric correlation work before your engineer opens a dashboard or writes a PromQL query.
The practical result is that your Alertmanager rules become more valuable, not less. The alerts that fire are the ones that genuinely required reactive response — novel failures, sudden degradations, events with no visible precursor. The predictable, trend-based failures that represent the majority of production incidents are handled proactively before Alertmanager fires.
As we covered in SRE On-Call 2026, the on-call experience improvement comes precisely from this separation: proactive situations handled during business hours, reactive alerts for the genuinely unpredictable.
The Prometheus AI SRE Stack
For a team currently running Prometheus with Grafana, the full Prometheus AI SRE stack looks like this:
Instrumentation (unchanged): Your services instrumented with either Prometheus client libraries or OpenTelemetry SDKs. Metrics exposed on scrape endpoints or exported via OTLP.
Collection (unchanged or minimal change): Prometheus scraping your endpoints on configured intervals. Or OpenTelemetry Collector receiving OTLP data and routing to Prometheus remote write. Either way, you add an additional OTLP export to OpsPilot.
Storage and visualization (unchanged): Prometheus storing your time-series metrics. Grafana querying Prometheus via PromQL. Your dashboards, panels, and alert rules exactly as they are.
Intelligence layer (what you add): OpsPilot’s Coworker, receiving your metrics via OTLP and running continuous AI SRE analysis. Pattern detection, trend analysis, cross-metric correlation, cost optimization, coverage assessment — delivered as situations to Slack or Microsoft Teams.
The metrics capability page covers the specific metric types and retention options in OpsPilot. The OpenTelemetry capability page covers the OTLP connection in detail.
FAQ
Does adding OpsPilot require migrating away from Prometheus? No. Prometheus stays exactly as it is. OpsPilot connects to your OTLP metrics stream alongside your existing Prometheus backend — it does not replace Prometheus, Alertmanager, or Grafana. Your scrape jobs, recording rules, and alert rules are unchanged.
What if I’m running Prometheus native scraping rather than OpenTelemetry? The OpenTelemetry Collector includes a Prometheus receiver that scrapes your existing Prometheus endpoints and exports the data via OTLP to OpsPilot. Your scrape configuration does not change. The Collector adds the OTLP export as an additional output alongside your existing Prometheus remote write or local storage.
What happens to my Alertmanager rules when Coworker starts? They continue to work exactly as before. Coworker operates upstream of Alertmanager — when it catches a trend early and your team resolves it proactively, the alert that would have fired doesn’t fire. When Alertmanager alerts do fire, Coworker provides immediate investigation context.
How is Prometheus AI SRE different from Prometheus recording rules and alerting? Recording rules and alerting rules are static — they evaluate the conditions you configured at the time you configured them. Coworker is dynamic — it watches your metrics continuously, detects trends and patterns you haven’t explicitly configured rules for, and learns your system’s specific behavior over time. The two complement each other: your rules catch the conditions you knew to look for, Coworker catches the patterns you didn’t know to configure.
Already running Prometheus? Add the intelligence layer in minutes.
OpsPilot is the AI SRE teammate for teams using OpenTelemetry, Prometheus, Grafana, and existing observability stacks — helping engineers investigate incidents, find root cause, and move toward autonomous operations without replacing their tools. OpsPilot, formerly FusionReactor Cloud, is Intergral’s AI-powered observability and AI SRE platform.