
Observability Gap Detection with OpenTelemetry: Finding Blind Spots Before an Incident Does
Observability gap detection OpenTelemetry coverage is one of the least-discussed but most operationally valuable capabilities in modern AI SRE — the systematic identification of where your observability coverage ends, before an incident reveals it for you.
Every production system has observability gaps. Services that are present in your architecture but not producing OTLP telemetry. Traces that break at specific service boundaries because context propagation was not implemented for that SDK or queue type. Log outputs that exist but are unstructured — searchable with regex but not correlatable with metrics or traces from the same request. Services where metrics are flowing but sampling rates are too aggressive to catch the long-tail latency patterns that matter.
These gaps don’t announce themselves. The first signal that a service is uninstrumented is usually the incident that implicates it — and the realization, mid-investigation, that no telemetry exists for the service that caused the problem. That’s when observability gap detection would have mattered. It just wasn’t running.
This post is about what systematic observability gap detection looks like with OpenTelemetry, how Coworker automates it continuously, and what the practical priority order for closing gaps should be.
The Four Types of Observability Gap
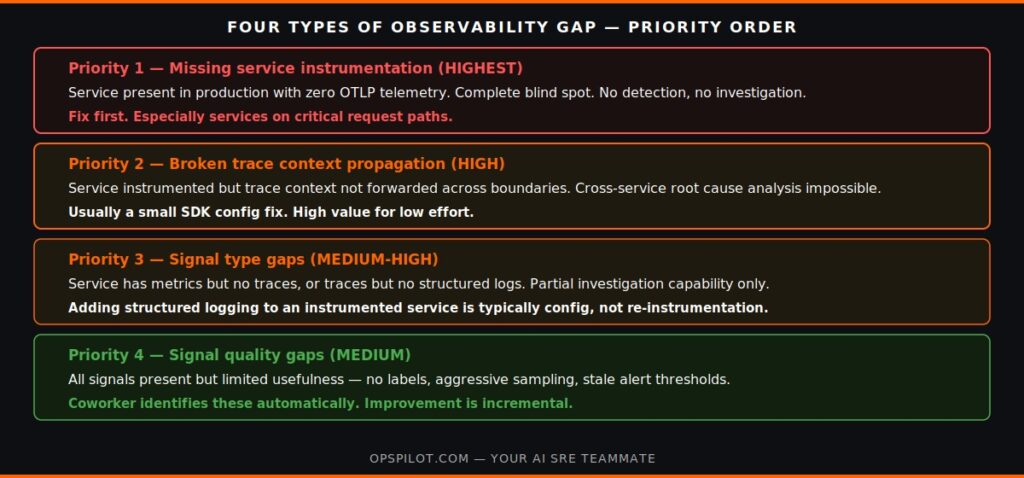
Observability gaps in OpenTelemetry stacks fall into four distinct categories — each with a different detection method, a different impact on reliability, and a different remediation priority.
Gap Type 1: Missing service instrumentation
The most consequential gap: a service that is present in production but generating no OTLP telemetry. It is completely invisible to your observability platform and to Coworker’s AI SRE detection.
How to detect it: Cross-reference your service catalog or architecture diagram against your OTLP telemetry sources. Any service that appears in one list but not the other is uninstrumented. In practice, the services most likely to be missing are: recently acquired services where instrumentation was deferred, legacy services running on frameworks without native OTLP support, third-party integrations that don’t expose telemetry, and batch processing systems that were deprioritized for instrumentation.
Impact: Complete blind spot. When an uninstrumented service is involved in an incident, it contributes nothing to investigation. Distributed traces terminate at the boundary with the uninstrumented service. Log correlation is impossible.
Priority: Highest. Any uninstrumented service that participates in critical request paths should be instrumented before any other gap type is addressed.
Gap Type 2: Broken trace context propagation
A service that is instrumented and producing metrics and logs, but where distributed trace context is not being propagated across service boundaries — breaking the trace chain and making cross-service correlation impossible.
How to detect it: Follow representative end-to-end user journeys as traces. A trace that ends before reaching a service you know was involved in the request has a broken propagation boundary. The most common break points are: async message queues where the trace context is not embedded in the message headers, services using older SDKs that don’t propagate the W3C TraceContext header, and third-party services where propagation is outside your control.
Impact: Partial blind spot. The service is visible in isolation but disconnected from the distributed trace. As we covered in Distributed Tracing 2026, broken propagation is one of the most common hidden gaps in observability stacks that appear complete.
Priority: High. Fixing broken propagation at a specific boundary is typically a small SDK configuration change — high value for low effort.
Gap Type 3: Signal type gaps
A service that is instrumented for one or two signal types but not all three. The most common patterns are: metrics without traces, and metrics with traces but without structured logs.
How to detect it: Build a signal type matrix — for each service, confirm which of metrics, logs, and traces it produces, and at what quality level. As we covered in Observability Platform Coverage, partial signal coverage often fails under investigation when the missing signal type contains the root cause.
Impact: Partial investigation capability. Priority: Medium-high. Adding structured logging to a service that already has metrics and traces is typically a configuration change rather than an instrumentation project.
Gap Type 4: Quality gaps within existing signals
A service that produces all three signal types, but where signal quality limits operational usefulness — metrics without meaningful labels, unstructured log output, aggressive trace sampling, stale alert thresholds.
How to detect it: Run an incident retrospective on your last five significant incidents and identify where investigation was limited by signal quality rather than signal absence.
Impact: Reduced investigation efficiency. Priority: Medium. Quality improvement is incremental.
How Coworker Automates Gap Detection
The manual gap detection process is valuable to run once. The problem is that gaps develop continuously as systems evolve. A service that was fully instrumented six months ago may have added a new dependency that is uninstrumented. A deployment may have introduced a code path that bypasses trace context propagation.
Coworker’s observability gap detection automates this process continuously, without requiring periodic manual audits.
Service coverage gap detection. Coworker cross-references the services visible in your metrics with the services present in your traces and logs. Services that appear in metrics but not traces are surfaced as gap situations with the specific service name, missing signal types, and prioritization based on how frequently the service appears in existing traces.
Propagation break detection. Coworker analyzes distributed traces for breaks — traces that terminate before reaching a service that was expected based on the service dependency map. Break points are surfaced with the specific service boundary where context propagation is failing.
Signal quality alerts. Coworker identifies services where signal quality limits detection effectiveness — sampling rates dropping significant traffic volume, unstructured log outputs, metrics without useful labels.
Deployment-triggered gap introduction. When a new deployment introduces a new service dependency or code path, Coworker detects the new pattern in trace topology and checks whether the new dependency is instrumented. If it isn’t, a gap situation is raised immediately.
For the broader coverage assessment framework, see Observability Platform Coverage. For how gap detection fits into OpenTelemetry maturity progression, see OpenTelemetry Maturity. For Kubernetes environments, see Kubernetes Observability.
Start your free trial to see Coworker’s gap detection report for your specific stack — app.opspilot.com/sign-up. No credit card required. First situations in 24 hours.
Prioritizing Gap Remediation
Priority 1: Critical path services with no instrumentation — most likely to hide the next significant incident root cause.
Priority 2: Propagation breaks on critical request paths — transforms isolated signals into a coherent distributed trace.
Priority 3: Missing structured logging on instrumented services — makes incident explanation possible, not just detection.
Priority 4: Signal quality improvements — incremental but systematic.
The observability cost post is worth reading alongside this one — teams often discover they are simultaneously paying for data they don’t need and missing data they do need.
For the OpenTelemetry instrumentation guidance and the pricing page — no form, no sales call.
Frequently Asked Questions
Coworker identifies uninstrumented services by cross-referencing your metrics sources with your trace and log sources. It prioritizes them by how frequently they appear as downstream dependencies in existing traces — services that are called frequently by instrumented services are higher priority than services that appear rarely, because they are more likely to be involved in incidents that affect instrumented services.
Coworker can identify where your traces terminate before reaching an external dependency — signaling that the dependency boundary is a gap in your observability. For true third-party services where instrumentation is not possible, Coworker identifies the gap and suggests boundary-level instrumentation: adding spans at the point where your code calls the external service, capturing the latency and error rate at the boundary even if the service itself is not instrumented.
New gaps introduced by deployments — a new service dependency, a new code path that bypasses trace propagation — are typically detected within the first 15-30 minutes of the deployment as traffic flows through the new path. The gap situation is raised immediately, before the new dependency has accumulated enough incident history to appear in retrospective analysis.
No. Gap detection is most valuable precisely because coverage is incomplete — it tells you specifically what is missing and prioritizes the gaps by operational impact. Starting gap detection with partial coverage produces a prioritized remediation roadmap. As gaps are closed, the detection accuracy of Coworker's proactive situation detection improves, creating a positive cycle: gap detection → instrumentation improvement → better situation detection → fewer undetected incidents.
Find your blind spots before your next incident does.
Start your free trial → app.opspilot.com/sign-up
Or talk it through: Book a demo → calendly.com/fusionreactor-sales/opspilot-demo
OpsPilot is the AI SRE teammate for teams using OpenTelemetry, Prometheus, Grafana, and existing observability stacks — helping engineers investigate incidents, find root cause, and move toward autonomous operations without replacing their tools. OpsPilot, formerly FusionReactor Cloud, is Intergral’s AI-powered observability and AI SRE platform.