
OpenTelemetry Maturity: Where Is Your Team on the Path to Full Observability?
OpenTelemetry maturity is not a binary state.
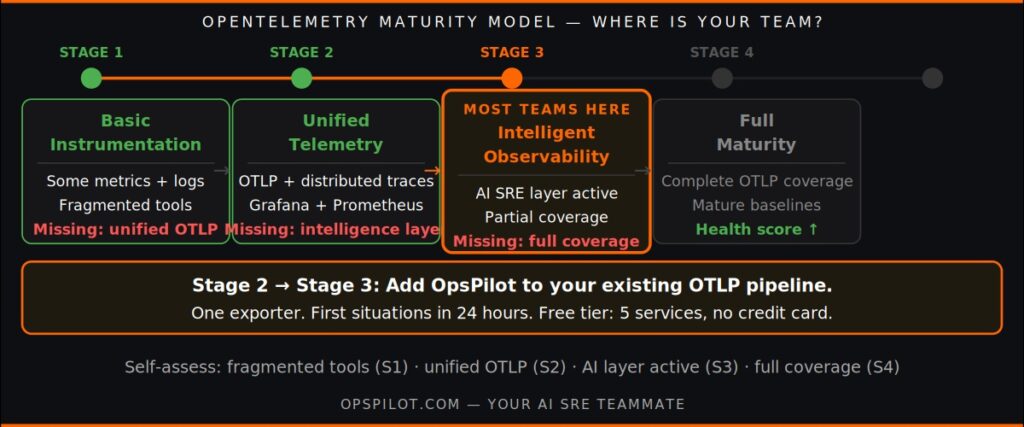
Teams do not move from “not using OpenTelemetry” to “fully instrumented” in a single step. The reality for most engineering teams is a gradual progression through stages — each stage representing a meaningful improvement in observability capability, each also representing a new set of questions about what comes next.
Understanding where your team sits on the OpenTelemetry maturity curve is useful for two reasons. First, it helps you prioritize the next investment accurately — the right next step depends entirely on where you currently are, and the right answer for a team at stage one is different from the right answer for a team at stage three. Second, it helps you communicate progress to leadership in terms that connect to operational outcomes rather than instrumentation percentages.
This post is a practical four-stage OpenTelemetry maturity model. For each stage, you will find a description of what it looks like, the key questions it raises, and what the next step actually involves. The goal is not to make your team feel behind — it is to help you identify clearly where you are and what would genuinely improve your situation.
Stage 1: Basic Instrumentation — You Have Data, But Not Telemetry
What it looks like:
Your services emit some metrics — probably through Prometheus client libraries or a vendor agent. You have logging. You may have alerting configured on a handful of critical metrics. You have dashboards that show you the state of your system when you look at them.
What you do not have is a unified telemetry pipeline. Your metrics, logs, and traces are separate — different tools, different formats, different query interfaces. Correlating a log entry with a metric change requires manual cross-referencing. Tracing a request across service boundaries is difficult or impossible without a distributed tracing setup.
What this stage feels like operationally:
When an incident occurs, your engineers spend 60-90 minutes orienting themselves — checking metrics in one tool, logs in another, trying to identify which service is the root cause by process of elimination. The data exists. The connection between the data points does not.
What OpenTelemetry maturity means at this stage:
The first OpenTelemetry maturity step is consolidating your telemetry into a unified pipeline. This means adopting the OpenTelemetry SDKs for your services, exporting metrics, logs, and traces via OTLP to a common collection point, and establishing trace context propagation across service boundaries.
The investment is non-trivial but well-defined. The OpenTelemetry capability page and the OpenTelemetry is now the standard post cover the migration path for teams at this stage.
Stage 2: Unified Telemetry — You Have OTLP, But Not Intelligence
What it looks like:
Your services are instrumented with OpenTelemetry SDKs. Metrics, logs, and traces are flowing through an OTLP pipeline — likely via the OpenTelemetry Collector or Grafana Alloy — to backends you query. You have distributed tracing. You can follow a request across service boundaries. Your Grafana dashboards are connected to your Prometheus metrics and your trace data.
This is the stage that the majority of engineering teams who have adopted OpenTelemetry have reached. It represents real progress. Instrumentation is portable. You are not locked into a proprietary agent. Your telemetry is queryable in a standard format.
What this stage feels like operationally:
The telemetry is there. The investigation work is not. When an incident occurs, you can now follow the trace, correlate the metrics, query the logs — all in one coherent data set. But someone still has to do that work. The 60-90 minute investigation phase has become 30-45 minutes because the tools are better integrated. It has not become 10-15 minutes because the analytical orientation work is still manual.
Your dashboards show you what happened when you look at them. They do not tell you what to look at. Your alerts fire when thresholds are crossed. They do not catch the trends forming before thresholds are reached.
What OpenTelemetry maturity means at this stage:
The second OpenTelemetry maturity step is adding the intelligence layer — the continuous analytical capability that watches your OTLP telemetry without being prompted and surfaces what matters before you query it.
As we covered in Your Observability Stack Is Missing Layer 3, this is the layer that most teams at stage two are missing. The collection infrastructure exists. The visualization layer exists. The analytical layer that converts telemetry into proactive, actionable intelligence does not yet exist.
Stage 3: Intelligent Observability — You Have AI Analysis, But Partial Coverage
What it looks like:
You have added an AI SRE intelligence layer to your OTLP pipeline. OpsPilot’s Coworker is receiving your telemetry and running continuous analysis. Situations are being surfaced proactively — patterns detected before thresholds are crossed, investigation context assembled before engineers engage, health scoring tracking operational quality over time.
The on-call experience has improved materially. Fewer 2am pages from predictable threshold crossings. Better context when alerts do fire. The team has a visible operational health trend to show leadership.
But your OpenTelemetry instrumentation is not complete. Some services are fully instrumented with metrics, logs, and traces. Others have only metrics. A few have no OpenTelemetry instrumentation at all — they are monitored by a legacy agent or by basic uptime checks. The AI analysis is as good as the telemetry it receives, and the gaps in instrumentation create analytical blind spots.
What this stage feels like operationally:
Coworker surfaces situations for the services where instrumentation is complete and accurate. For the services with partial coverage, its detection is less precise. For the uninstrumented services, it has nothing to work with. Coverage gaps appear as a category of situations — Coworker identifies the gaps — but until the instrumentation is improved, the intelligence layer cannot fully close them.
What OpenTelemetry maturity means at this stage:
The third OpenTelemetry maturity step is closing the instrumentation gaps. This means prioritizing the services where incomplete coverage is creating blind spots — the services most likely to cause incidents, most likely to be involved in cascading failures, most critical to business operations.
The prioritization is informed by what Coworker surfaces. The services that appear most frequently in incident correlation but have incomplete trace propagation are the highest-priority instrumentation targets. The services that Coworker flags as coverage gaps are the ones where investment produces the clearest improvement in detection quality.
Stage 4: Full OpenTelemetry Maturity — Intelligence Across Your Entire Stack
What it looks like:
Your services are fully instrumented with OpenTelemetry. Metrics, logs, and traces flow via OTLP across your entire production topology. Trace context propagates across every service boundary. Coworker has complete telemetry to work with, and its detection has matured as baselines have stabilized over months of operation.
Situations surface consistently for the patterns that precede incidents. The team resolves most operationally significant issues during business hours. On-call is quieter — fewer pages, and when pages do occur, the investigation context is complete. The health score is trending upward and is used in quarterly engineering reviews to show operational improvement to leadership.
The AI analysis is contributing to cost optimization — surfacing specific over-provisioned resources, idle allocations, and inefficient configurations that are visible in the metrics data but required systematic review to find. The cloud cost savings surfaced in a typical month meaningfully offset the platform cost.
What this stage feels like operationally:
This is what mature OpenTelemetry observability actually produces — not just better dashboards, but a fundamentally different relationship between your engineering team and your production system. The team is upstream of most problems rather than downstream of them. The engineer’s job during incidents is judgment and remediation rather than orientation and investigation.
This is the goal of the OpenTelemetry maturity journey. Getting there requires moving through stages one through three — there are no shortcuts, and the investment at each stage is real. But the operational outcome at stage four is qualitatively different from stage two, and the path from here to there is clearly defined.
Self-Assessment: Where Is Your Team?
The quickest way to identify your OpenTelemetry maturity stage:
You are at Stage 1 if: Your telemetry is fragmented across multiple tools and formats, and correlating signals across services requires manual cross-referencing between separate systems.
You are at Stage 2 if: You have a unified OTLP pipeline and distributed tracing, but incident investigation still requires manual analytical work after the alert fires.
You are at Stage 3 if: You have an AI SRE intelligence layer surfacing situations proactively, but instrumentation gaps exist for some services in your production topology.
You are at Stage 4 if: Full instrumentation, mature baselines, proactive detection across your entire stack, and health scoring trending upward quarter over quarter.
Most teams reading this post are at Stage 2 or early Stage 3. The most common next step is adding the intelligence layer — connecting OpsPilot’s Coworker to the existing OTLP pipeline you already have.
The free tier — five services, daily analysis, unlimited Slack notifications, no credit card — is designed for teams at Stage 2 who want to evaluate what the intelligence layer produces on their specific stack before committing to a paid tier. First situations arrive within 24 hours. See /pricing/ for the full tier comparison, no form, no sales call.
As we covered in OpenTelemetry Without Intelligence Is Just Expensive Data Collection, the investment in OpenTelemetry instrumentation only delivers its full return when the intelligence layer is in place to act on what the telemetry contains.
FAQ
How long does it take to move through the OpenTelemetry maturity stages?
Stage 1 to Stage 2 is typically a three to six month project for a team of five to fifteen services. Stage 2 to Stage 3 — adding an AI SRE intelligence layer — is a configuration change of minutes: pointing an additional OTLP exporter at OpsPilot. Stage 3 to Stage 4 — closing instrumentation gaps — typically takes six to twelve months as teams prioritize and close gaps systematically.
Do we need to complete Stage 2 before adding an AI SRE intelligence layer?
Not necessarily. If you have partial OTLP instrumentation, you can add Coworker to receive the OTLP data you already have. Coworker will analyze the services where instrumentation exists and identify gaps for the services where it does not. The intelligence layer improves as instrumentation coverage improves, rather than requiring complete coverage before it provides value.
What is the most common instrumentation gap at Stage 3?
The most common gaps are distributed trace propagation and log correlation. Many teams have metrics from OpenTelemetry but incomplete trace context propagation across service boundaries — which limits the cross-service correlation that makes AI incident investigation most effective. The second most common gap is structured logging — services that emit unstructured logs that cannot be correlated with trace spans or metric events.
How does OpenTelemetry maturity affect the quality of AI SRE analysis?
The AI SRE intelligence layer is as good as the telemetry it receives. At Stage 3, with partial instrumentation, Coworker can analyze the services where data is complete and identify gaps for the services where it does not. At Stage 4, with complete instrumentation, Coworker can perform full cross-service correlation, accurately identify root cause in complex cascading failures, and provide the complete investigation context that reduces incident resolution time most dramatically.

Already at Stage 2? Add the intelligence layer in minutes.
Start your free trial → app.opspilot.com/sign-up
OpsPilot is the AI SRE teammate for teams using OpenTelemetry, Prometheus, Grafana, and existing observability stacks — helping engineers investigate incidents, find root cause, and move toward autonomous operations without replacing their tools. OpsPilot, formerly FusionReactor Cloud, is Intergral’s AI-powered observability and AI SRE platform.