
Observability Platform Consolidation: From Tool Sprawl to Operational Intelligence
Most engineering teams are running more observability tools than they need — and the observability platform consolidation opportunity in 2026 is better than it has ever been. The average team in 2026 has between four and seven overlapping tools in their observability stack: a metrics platform, a log management tool, a distributed tracing backend, an APM solution, an alerting platform, an on-call routing tool, and an incident management system. Some of these overlap significantly. Most were added incrementally as the team and stack grew, each solving a specific problem that the existing tools didn’t address at the time.
The result is tool sprawl — a fragmented observability landscape where telemetry is split across systems, engineers context-switch between interfaces during incident investigation, alert routing crosses multiple platforms, and the cost of running the stack is larger than the operational value it produces.
Tool sprawl is not a new problem. What is new in 2026 is that the consolidation opportunity is materially better than it was two or three years ago. The maturation of OpenTelemetry as a standard telemetry pipeline means that a single observability platform can receive metrics, logs, and traces through a unified OTLP stream — without requiring re-instrumentation of the applications being monitored. The emergence of AI site reliability engineering (SRE) as a genuine platform capability means that a consolidated observability platform can do more than store and visualize telemetry — it can watch it continuously, correlate signals automatically, and surface what matters without being asked.
This post is about what the consolidation opportunity looks like in 2026, what drives tool sprawl in the first place, and what engineering teams should look for when consolidating onto a single observability platform.
Why Tool Sprawl Happens
Tool sprawl in observability stacks is not the result of poor planning. It is the natural consequence of how engineering teams grow and how observability problems present themselves.
Incremental adoption
Every tool in a sprawling observability stack was added to solve a specific problem. Prometheus for metrics because the previous metrics tool didn’t support the new Kubernetes environment. Loki for logs because the existing log solution was too expensive at scale. Jaeger for traces when distributed tracing became necessary. PagerDuty for on-call routing because the team had outgrown manual escalation. Each addition was individually justified.
The sprawl accumulates because tools are added but rarely removed. The old metrics tool continues to run alongside Prometheus for the services that haven’t been migrated. The previous logging solution handles some services while Loki handles others. The overlap generates duplicate costs and split telemetry — making cross-service correlation harder rather than easier.
Organizational purchasing patterns
In larger engineering organizations, observability tools are often purchased at team or department level rather than centrally. The platform engineering team adopts one stack. The application engineering team adopts a different set of tools. When these teams need to collaborate on incidents, they are working from different telemetry pictures with different interfaces and different alert routing.
This organizational fragmentation compounds over time. The observability stack reflects the organizational history of the company as much as its current technical needs.
Point solutions solving point problems
Some observability tools exist specifically to solve the problems that general-purpose observability platforms don’t address well. Alert fatigue management tools. Incident post-mortem automation. SLO tracking dashboards. Each addresses a genuine gap. Each adds another interface, another integration to maintain, and another cost line in the observability budget.
The proliferation of point solutions is a signal that the primary observability platform is not meeting the team’s full operational needs — producing the conditions that drive additional point solution purchases, which compounds the sprawl.
What Operational Intelligence Consolidation Looks Like
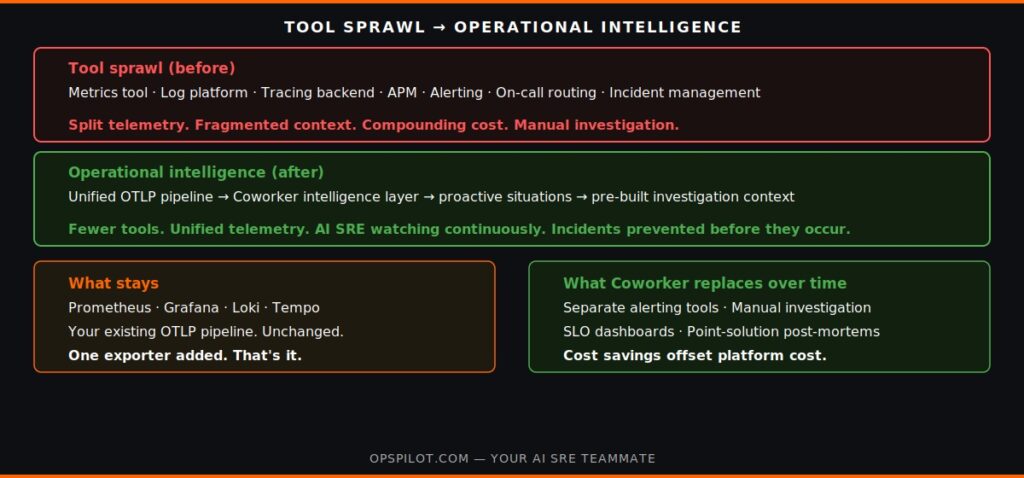
The consolidation opportunity in 2026 is not about replacing all existing tools with a single platform overnight. It is about establishing a unified telemetry foundation through OpenTelemetry and adding an intelligence layer above it that reduces the operational need for the point solutions that tool sprawl has accumulated.
The distinction between an observability platform and an operational intelligence platform is important here. An observability platform stores and visualizes telemetry — dashboards, alert rules, query interfaces. An operational intelligence platform watches the telemetry continuously, correlates signals autonomously, surfaces what matters without being asked, and learns from the system over time.
Most teams in 2026 have observability. The consolidation opportunity is adding operational intelligence above it — not replacing the observability layer, but adding the intelligence layer that reduces the need for separate alerting platforms, separate incident investigation tools, and separate SLO tracking solutions.
OpsPilot’s Coworker adds this intelligence layer to your existing OTLP stack — whether that stack is Prometheus and Grafana, a commercial platform like Datadog, or any combination of tools that produces OTLP telemetry. Coworker receives the unified telemetry stream and provides:
Proactive situation detection. The continuous pattern analysis that replaces alert-based reactive monitoring for the majority of incidents. Situations surfaced before thresholds are crossed, during business hours, before on-call engineers are paged. As we covered in Observability Cost, proactive detection reduces the need for high-sensitivity alert configurations that generate noise.
Pre-assembled investigation context. The root cause analysis that replaces manual investigation tooling. When a situation escalates to an incident, Coworker’s investigation context — affected service, correlated signals, recommended action, estimated effort — replaces the manual dashboard querying that takes 45-90 minutes on a typical reactive platform.
Health score and trend visibility. The operational health metric that replaces separate SLO tracking dashboards and engineering reporting tools. A single score trending over time that makes reliability investment visible to leadership without requiring a separate reporting layer.
Native incident management. The structured incident workflow that reduces the need for a separate incident management platform alongside the observability stack. As we covered in AI SRE Platform and Incident Management, OpsPilot’s native incident management integrates with the proactive detection layer rather than sitting downstream of it.
Ready to see what operational intelligence consolidation looks like on your stack? Book a demo at calendly.com/fusionreactor-sales/opspilot-demo
The Consolidation Decision Framework
For engineering leaders evaluating an observability platform consolidation, three questions structure the decision:
What is your telemetry foundation? If your stack is already producing unified OTLP telemetry through OpenTelemetry, you are ready to add an intelligence layer immediately — no migration required. If your telemetry is fragmented across multiple agent-based collection systems, the consolidation path starts with OpenTelemetry standardization. As we covered in AI SRE vs AIOps, the OTLP foundation is what makes the intelligence layer deployable without migration.
What problems is your current stack not solving? List the operational problems your team has that the current observability tools don’t address: proactive detection gaps, manual investigation time, alert fatigue, fragmented incident management. These are the gaps that consolidation onto an operational intelligence platform addresses. A platform evaluation should be measured against these specific gaps, not against feature comparison matrices.
What can be removed? Every tool that the consolidated platform replaces reduces both cost and operational complexity. Identify the point solutions in your current stack — the separate alerting tool, the SLO dashboard, the post-mortem automation — and evaluate whether an operational intelligence platform makes them redundant. The cost saving from removing these tools typically offsets a significant proportion of the consolidated platform cost.
For the evaluation framework that applies these questions in detail, see How to Evaluate an AI SRE Platform. For the Operational Resilience metrics that make the consolidation case to leadership, see Operational Resilience 2026. For pricing — no form, no sales call — see the pricing page.
Frequently Asked Questions
No. OpsPilot adds to your existing observability stack rather than replacing it. Coworker connects to your OTLP pipeline as an additional intelligence layer — your existing Prometheus, Grafana, Loki, and other tools continue unchanged. Consolidation is a gradual process: as Coworker's proactive detection and investigation context mature, the need for separate point solutions reduces, and those tools can be retired when you're ready. The consolidation is driven by demonstrated value rather than forced migration.
Most teams start seeing meaningful consolidation within 90 days — specifically, the reduction in need for separate alerting tools and manual investigation tooling as Coworker's proactive detection and pre-assembled investigation context mature. Full consolidation, including retiring separate incident management and SLO tracking tools, typically takes 6-12 months as team familiarity with the OpsPilot workflow grows. The timeline is driven by confidence, not by migration requirements.
It doesn't. Your Grafana dashboards, Prometheus alert rules, and existing on-call routing all remain operational throughout and after consolidation. Coworker operates above them as an intelligence layer rather than replacing them. As proactive detection catches more situations before alert thresholds are crossed, the practical reliance on alert-based monitoring decreases — but nothing is removed or broken by the addition of Coworker.
The cost case has three components: platform cost savings from retiring point solutions, engineering time savings from reduced investigation and triage, and incident cost reduction from proactive detection. For most teams with significant tool sprawl, the platform cost savings from retiring 2-3 point solutions alone covers a meaningful proportion of the OpsPilot platform cost. The engineering time and incident savings are on top of that. See the pricing page for tier comparison — no form, no sales call.
From tool sprawl to operational intelligence. Start with your existing OTLP data.
Book a demo → calendly.com/fusionreactor-sales/opspilot-demo
Or start today: Free trial → app.opspilot.com/sign-up
OpsPilot is the AI SRE teammate for teams using OpenTelemetry, Prometheus, Grafana, and existing observability stacks — helping engineers investigate incidents, find root cause, and move toward autonomous operations without replacing their tools. OpsPilot, formerly FusionReactor Cloud, is Intergral’s AI-powered observability and AI SRE platform.