
What Is An Observability Platform? (And Why Most Teams Only Have Half Of One)
“Observability platform” is one of the most searched terms in the DevOps and SRE space in 2026. It’s also one of the most inconsistently defined.
Ask ten engineers what an observability platform is and you’ll get ten answers. Datadog. Grafana. A combination of Prometheus and Loki and Tempo. OpenTelemetry plus whatever backend you’re sending data to. The thing that shows your dashboards. The thing that fires your alerts.
All of these answers describe real observability tools. None of them describes a complete observability platform.
The distinction matters — not as a semantic exercise, but because understanding what a complete observability platform actually does is the difference between teams that spend their observability budget efficiently and teams that spend it reactively.
What An Observability Platform Actually Is
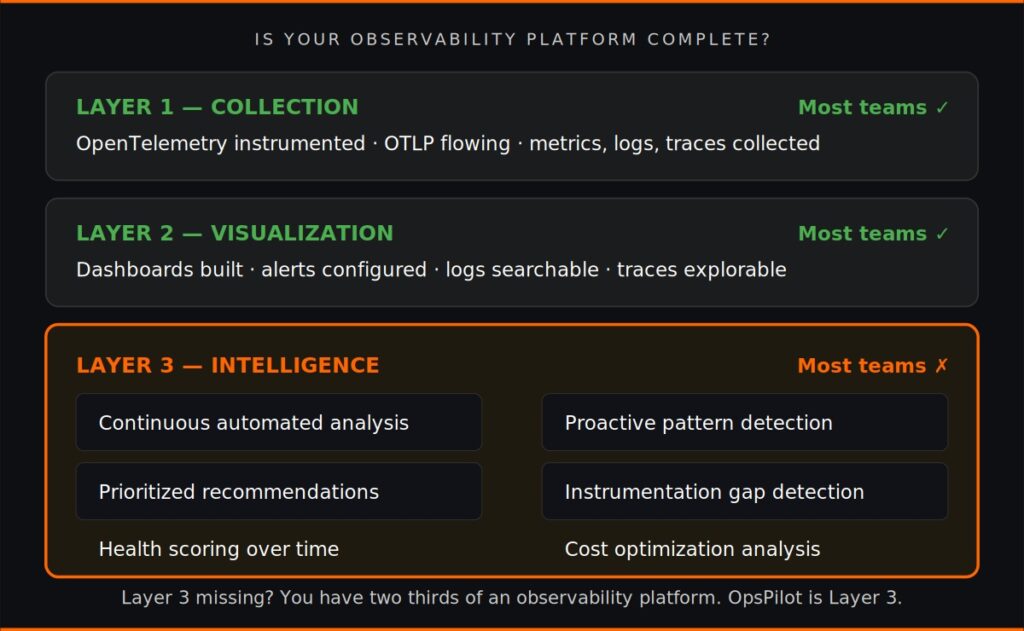
A complete observability platform does three things, in sequence, and all three have to be present for the platform to deliver its full value.
Layer 1: Collection
The first layer is telemetry collection — getting data out of your systems and into a place where it can be analyzed. Metrics, logs, and traces from every service, every infrastructure component, every integration.
OpenTelemetry has largely solved this problem. As a vendor-neutral instrumentation standard with SDK support across every major language and framework, it provides a consistent, interoperable way to collect the three primary signal types and transport them via OTLP to any compatible backend. The collection problem, for teams that have adopted OpenTelemetry, is largely answered.
This is the layer most engineering teams have. It’s the one that gets the most investment, the most tooling attention, and the most engineering time.
Layer 2: Visualization
The second layer is making collected data visible and queryable. Dashboards, graphs, alert rules, log search, trace exploration — the interfaces that let engineers interrogate the state of their systems.
Grafana, Datadog, and their peers have built excellent tooling here. The visualization layer is mature, capable, and well-understood. Teams can build sophisticated dashboards, configure nuanced alerting, and query their data with precision.
This is the layer most engineering teams also have. The combination of a good collection pipeline and a good visualization backend is what most people mean when they say “observability platform.”
But it’s only two thirds of one.
Layer 3: Intelligence
The third layer is continuous automated analysis of the data that layers 1 and 2 produce — and this is the layer that most teams are missing.
A complete observability platform doesn’t just collect data and make it visible. It analyzes that data continuously, identifies what matters, connects signals across services, matches patterns against known failure signatures, surfaces cost waste, detects instrumentation gaps, and delivers prioritized recommendations.
This is the layer that turns an observability tool into an observability platform in the full sense. Without it, you have a sophisticated data collection and visualization system. With it, you have something that actively works on your behalf.
Think your observability platform is complete? See what the intelligence layer finds in your stack. Start your free trial at app.opspilot.com/sign-up
Why Most Teams Are Missing Layer 3
The intelligence layer didn’t exist in accessible form until recently. Understanding why requires a brief history of how observability tooling evolved.
The first generation of observability tooling — metrics systems, log aggregators, APM agents — solved the collection problem. Getting data out of production systems was genuinely hard, and these tools made it tractable.
The second generation solved the visualization problem. Grafana made it possible to build sophisticated dashboards from any data source. Datadog built a unified platform that combined collection and visualization with alerting. The tooling for making data visible and queryable became excellent.
The intelligence layer — continuous automated analysis that produces actionable conclusions rather than visualizations — requires machine learning, pattern matching at scale, and the ability to correlate signals across multiple data sources simultaneously. This required a level of computational capability and data science maturity that simply wasn’t accessible to most teams until the last few years.
It’s now accessible. The question is whether teams know it’s missing and know how to add it.
Most don’t, because the observability market has not done a good job of distinguishing between the three layers. A vendor that sells collection and visualization tools has every incentive to call their product an “observability platform” — the term is aspirational and sticky. A team that buys that product reasonably concludes they have an observability platform.
They have two thirds of one.
As we explored in Your Observability Stack Is Missing Layer 3, the intelligence gap is the most consequential gap in modern observability stacks — not because the other layers aren’t valuable, but because without layer 3 the value of layers 1 and 2 is limited to reactive use.
What Layer 3 Changes In Practice
The difference between a two-layer observability setup and a complete three-layer observability platform shows up most clearly in three specific situations.
Before incidents
A two-layer platform tells you what is happening right now. An engineer checks a dashboard, sees normal metrics, and moves on. The connection pool trending toward saturation at 87% utilization doesn’t trigger an alert yet. The memory growth trend that has been building for 72 hours doesn’t appear on any dashboard an engineer checks regularly.
A three-layer platform is watching both of those signals continuously. It matches the connection pool trend against the known pattern for connection pool exhaustion. It flags the memory growth trend before it crosses a threshold. It delivers a prioritized recommendation to Slack before any alert fires.
The team that has the third layer prevents incidents the team without it responds to.
During incidents
A two-layer platform provides the data for a manual investigation. An alert fires. An engineer opens dashboards, checks metrics, follows trace spans, cross-references deployment events, and eventually arrives at a root cause. As we covered in You Have 10,000 Metrics. Why Does Root Cause Still Take 3 Hours?, this typically takes two to four hours.
A three-layer platform has already done the correlation work. The pattern has been matched, the root cause identified, the recommended action specified. The engineer arrives at the incident with context already assembled and a hypothesis already formed. Investigation time collapses from hours to minutes.
Across the observability stack itself
A two-layer platform cannot evaluate its own coverage. It collects what it’s configured to collect and visualizes what it’s configured to visualize. Instrumentation gaps — services that aren’t fully traced, database calls that don’t propagate context, external API calls that create blind spots — are invisible until an incident exposes them.
A three-layer platform evaluates coverage continuously. It identifies which services have incomplete instrumentation. It flags which trace paths have breaks. It surfaces the gaps before they matter rather than after. This is the gap detection capability that OpsPilot’s services view provides — a continuous assessment of observability coverage quality rather than a static assumption that instrumentation is complete.
How To Evaluate Whether Your Observability Platform Is Complete
Three questions that tell you whether you have two layers or three:
Does your platform tell you what to fix, or just show you what’s happening?
A platform that shows you data has layer 2. A platform that tells you which three things are worth fixing today, in priority order, with estimated effort and business impact, has layer 3. As we argued in Dashboards Show You What Happened. This Is What Tells You What To Do Next., this distinction defines whether observability is reactive or proactive.
Does your platform analyze continuously or only when you ask it to?
A platform that responds to queries has layer 2. A platform that runs analysis on your telemetry continuously — every hour, on your configured schedule — and surfaces findings without being asked has layer 3. The difference is push versus pull. Layer 2 is pull: you go looking for problems. Layer 3 is push: problems come to you.
Can your platform quantify the value of your observability investment?
A platform that shows dashboards cannot tell you whether your observability is improving or declining over time. A platform with health scoring — tracking observability maturity, error rate management, performance, alerting effectiveness, and cost efficiency as measurable dimensions — gives you the data to demonstrate that investment in observability is generating measurable operational improvement.
Adding Layer 3 To Your Existing Stack
The good news for teams that have invested in layers 1 and 2 is that adding layer 3 does not require replacing either.
OpsPilot connects to your existing OpenTelemetry data via OTLP — the same transport your telemetry is already using to reach your visualization backend. No changes to instrumentation. No migration of data. No rework of dashboards or alerting.
Your Grafana instance stays. Your Datadog dashboards stay. Your PagerDuty routing stays. Layer 3 sits above all of them, analyzing the same data your existing tools are collecting and visualizing, and delivering conclusions — not more dashboards — to your team.
The proactive AI capability is what makes this possible: continuous pattern analysis running on your existing telemetry, surfacing the findings that require action in the channel your team already uses.
This is what makes a two-layer observability setup into a complete observability platform. Not replacing what works. Adding what’s missing.
The Observability Platform Checklist
A complete observability platform in 2026 should be able to answer yes to all of the following:
Collection layer (Layer 1) ✓
- OpenTelemetry instrumentation across all services
- Metrics, logs, and traces flowing via OTLP
- Complete trace propagation across service boundaries
Visualization layer (Layer 2) ✓
- Dashboards for key services and infrastructure
- Alert rules configured for critical thresholds
- Log search and trace exploration available
Intelligence layer (Layer 3) — does yours have this?
- Continuous automated analysis of telemetry data
- Proactive pattern detection before incidents fire
- Automated correlation across metrics, logs, and traces
- Prioritized recommendations with specific actions
- Instrumentation gap detection
- Health scoring across multiple operational dimensions
- Cost optimization analysis from resource utilization metrics
If the third section is mostly unanswered, you have two layers of an observability platform. The third is what turns the investment in the first two into a complete operational intelligence system.
FAQ
What’s the difference between an observability platform and a monitoring tool? Monitoring tools track specific metrics against thresholds and alert when they’re breached. Observability platforms collect the full telemetry picture — metrics, logs, and traces — to make a system’s internal state understandable from its external outputs. A complete observability platform adds a third capability: continuous intelligence that analyzes that telemetry and surfaces conclusions without requiring manual investigation.
Is Grafana an observability platform? Grafana is an excellent visualization layer — Layer 2 in the three-layer model. Combined with Prometheus for metrics, Loki for logs, and Tempo for traces, it provides a comprehensive collection and visualization stack. It does not include a continuous intelligence layer. Teams using the Grafana stack have two thirds of a complete observability platform and need to add Layer 3 separately.
Is Datadog an observability platform? Datadog is a sophisticated two-layer observability platform with some AI features. Its anomaly detection and forecasting capabilities provide elements of intelligence, but as we explored in AIOps in 2026, AI features in a monitoring tool are different from a continuous intelligence layer that proactively surfaces recommendations and learns from your specific system over time.
How much does adding the intelligence layer cost? See opspilot.com/pricing for a full comparison — no form, no sales call. For most mid-sized teams, the infrastructure cost optimizations surfaced by Layer 3 in the first month more than offset the platform cost.
You have Layer 1 and Layer 2. Here’s what Layer 3 finds in your stack.
Start your free trial at app.opspilot.com/sign-up
OpsPilot is an AI-powered observability intelligence platform that continuously analyzes your OpenTelemetry data and delivers prioritized recommendations, health scoring, and gap detection — directly to your team. Built by APM engineers with two decades of experience.